| Fire incidents reported |
|---|
| Sreet name | Count |
|---|
| RT 12 | 26 | | STATE ROUTE 12 | 16 | | JOHN ST | 14 | | TRENTON RD | 12 | | MAPPA AVE | 10 | | OLD POLAND RD | 10 | | RTE 12 | 10 | | STATE RTE 12 | 10 | | JOHN ST | 8 | | MAPLEDALE ACRES | 8 | | TRENTON FALLS ROAD RDS | 8 | | TRENTON RD | 8 | | BLUE HERON DR | 6 | | BOONE ST | 6 | | FISH HATCHERY RD | 6 | | FISH HATCHERY ROAD RDS | 6 | | OLD POLAND RD | 6 | | OLD POLAND ROAD RDS | 6 | | PARTRIDGE HILL RD | 6 | | PLANK RD | 6 | | STATE ROUTE 12 RT | 6 | | 12 RT | 4 | | BLUE RD | 4 | | BOONE STREET ST | 4 | | CURRY HILL RD | 4 |
| | | Fire incidents reported |
|---|
| Sreet name | Count |
|---|
| DOVER RD | 4 | | HULSER RD | 4 | | JOHN STREET ST | 4 | | KORBER RD | 4 | | MAPLEDALE RD | 4 | | MAPPA AVE | 4 | | MAPPA AVE AVE | 4 | | OLD REMSEN RD | 4 | | PLANK ROAD RDS | 4 | | ST RT 12 HWY | 4 | | STAGE RD | 4 | | STATE ROUTE 28 | 4 | | STATE RT 12 | 4 | | STATE RTE 28 | 4 | | STATE RTE 365 | 4 | | TRENTON FALLS RD | 4 | | TRENTON FALLS RD | 4 | | TRENTON ROAD RDS | 4 | | 12 | 2 | | 365 RT | 2 | | 517 BEECHER RD | 2 | | 7980 ROTE 12 | 2 | | 8170 ROTE 12 HWY | 2 | | 8457 TRENTON FALLS RD | 2 | | |
|
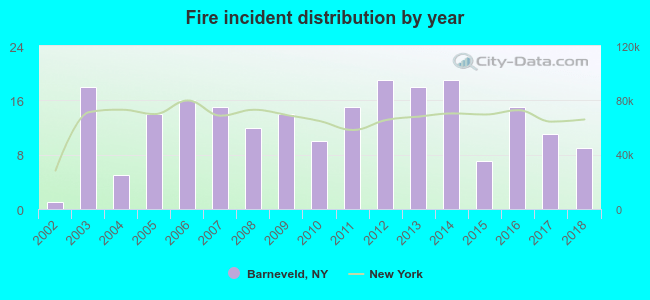 Based on the data from the years 2002 - 2018 the average number of fires per year is 13. The highest number of reported fires - 19 took place in 2012, and the least - 1 in 2002. The data has a rising trend.
 28.4% incidents where reported in the morning and 71.6% in the evening. The most fires (17.9%) took place on Thursday, and the least (11.0%) on Saturday.
 Based on the 218 reports from years 2002 - 2018 most fires (17.9%) took place during January, and the least (3.7%) in May.
 Out of all 1,317 cases reported during the years 2002 - 2018, the most belonged to the categories: Rescue & EMS (46.1%), Hazardous Condition (19.7%), and Fire (16.6%).
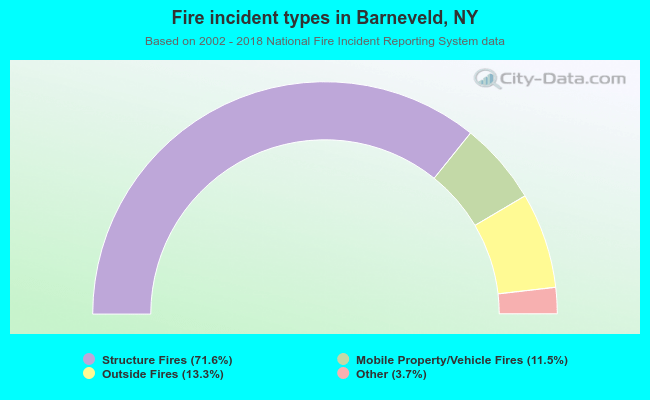 When looking into fire subcategories, the most incidents belonged to: Structure Fires (71.6%), and Outside Fires (13.3%).