Barre: Fire Incidents, Vermont (VT)
Where are fire incidents reported in Barre, VT
Something went wrong! Please refresh the page.
|
| |||||||||||||||||||||||||||||||||||||||||||||||||||||||||||||||||||||||||||||||||||||||||||||||||||||||||||||
2002 - 2018 National Fire Incident Reporting System (NFIRS) incidents
- Incident types reported to NFIRS in Barre, VT
- 79333.6%Rescue & EMS
- 47220.0%Hazardous Condition
- 45919.5%Fire
- 25810.9%Service Call
- 24310.3%False Alarm
- 1185.0%Good Intent Call
- 70.3%Overpressure Rupture
- 60.3%Special Incident
- Fire incident types reported to NFIRS in Barre, VT
- 27760.3%Structure Fires
- 10222.2%Outside Fires
- 449.6%Other
- 367.8%Mobile Property/Vehicle Fires
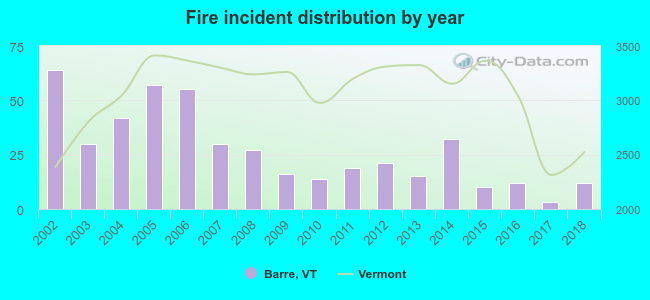 Based on the data from the years 2002 - 2018 the average number of fire incidents per year is 27. The highest number of reported fires - 64 took place in 2002, and the least - 3 in 2017. The data has a dropping trend.
The average number of yearly fire incidents per 10k residents in Barre, VT compared to nearest cities:
(Note: Based on data for the last 3 years, including only cities with population 5,000 and above)
| Barre: | 10.2 |
| Montpelier: | 37.8 |
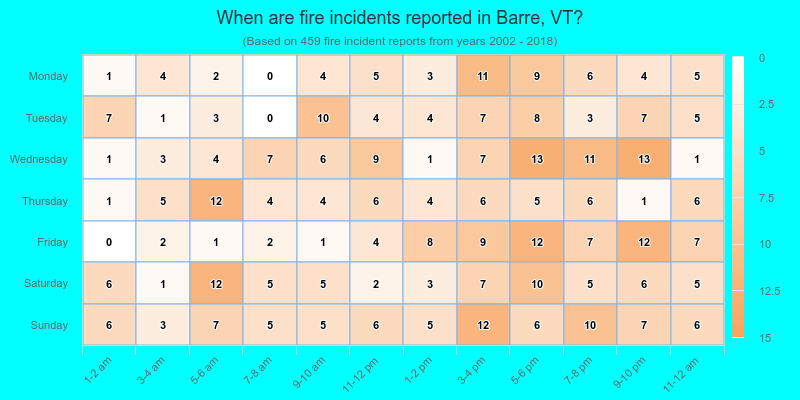
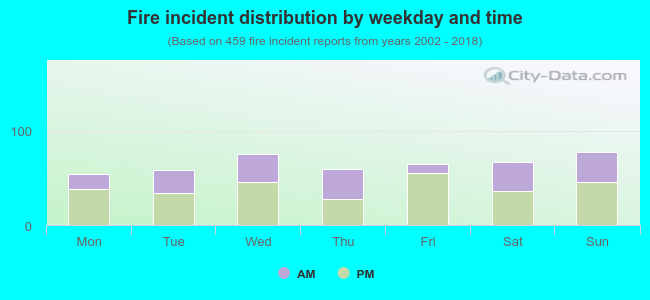 38.3% incidents where reported in the morning and 61.7% in the evening. The most fires (17.0%) took place on Sunday, and the least (11.8%) on Monday.
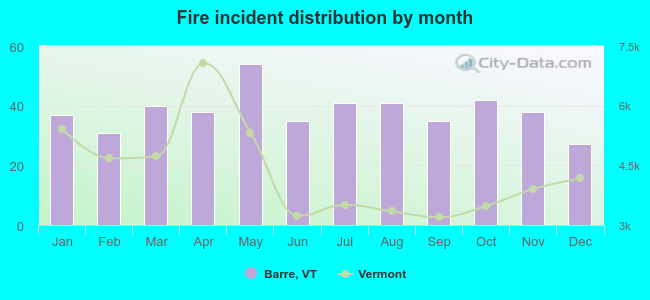 According to the 459 fire incidents from years 2002 - 2018 most fires (11.8%) took place during May, and the least (5.9%) in December.
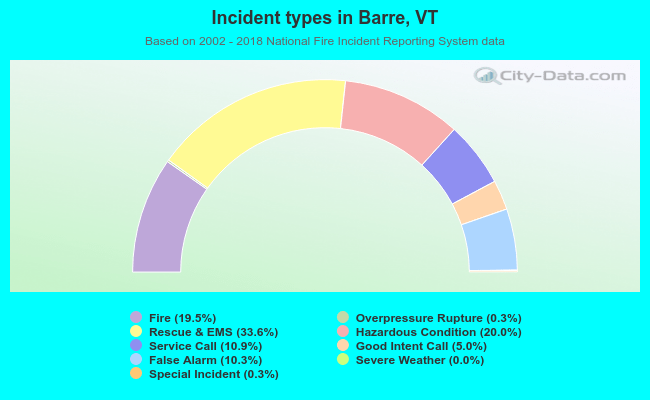 Out of all 2,357 cases reported during the years 2002 - 2018, the most belonged to the categories: Rescue & EMS (33.6%), Hazardous Condition (20.0%), and Fire (19.5%).
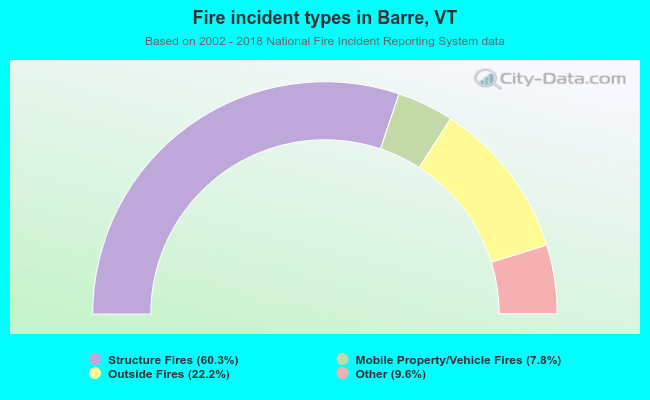 When looking into fire subcategories, the most reports belonged to: Structure Fires (60.3%), and Outside Fires (22.2%).