Bartonville: Fire Incidents, Texas (TX)
Where are fire incidents reported in Bartonville, TX
Something went wrong! Please refresh the page.
|
| |||||||||||||||||||||||||||||||||||||||||||||||||||||||||||||||||||||||||||||||||||||||||||||||||||||||||||||
2002 - 2018 National Fire Incident Reporting System (NFIRS) incidents
- Incident types reported to NFIRS in Bartonville, TX
- 31838.5%Rescue & EMS
- 18121.9%Fire
- 11413.8%Service Call
- 9811.9%Good Intent Call
- 587.0%Hazardous Condition
- 536.4%False Alarm
- 20.2%Special Incident
- 10.1%Overpressure Rupture
- Fire incident types reported to NFIRS in Bartonville, TX
- 8949.2%Outside Fires
- 6334.8%Structure Fires
- 168.8%Other
- 137.2%Mobile Property/Vehicle Fires
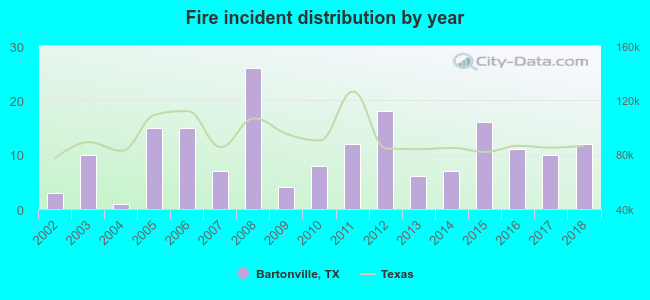 Based on the data from the years 2002 - 2018 the average number of fires per year is 11. The highest number of reported fire incidents - 26 took place in 2008, and the least - 1 in 2004. The data has a rising trend.
 33.1% incidents where reported in the morning and 66.9% in the evening. The most fires (17.1%) took place on Wednesday, and the least (12.2%) on Tuesday.
 Based on the 181 reports from years 2002 - 2018 most fires (14.4%) took place during January, and the least (3.3%) in June.
 Out of all 825 cases reported during the years 2002 - 2018, the most belonged to the categories: Rescue & EMS (38.5%), Fire (21.9%), and Service Call (13.8%).
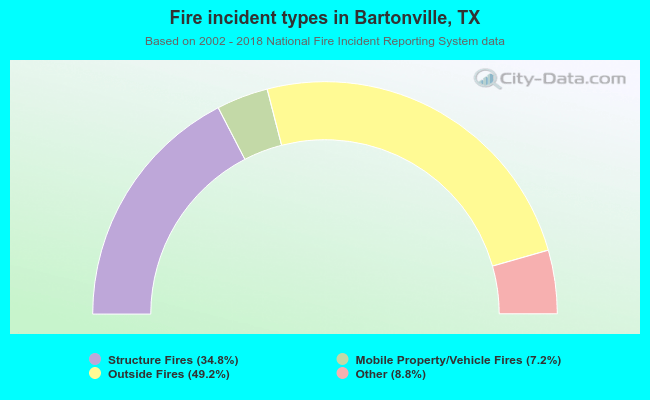 When looking into fire subcategories, the most reports belonged to: Outside Fires (49.2%), and Structure Fires (34.8%).