Bassfield: Fire Incidents, Mississippi (MS)
Where are fire incidents reported in Bassfield, MS
Something went wrong! Please refresh the page.
|
| |||||||||||||||||||||||||||||||||||||||||||||||||||||||||||||||||||||||||||||||||||||||||||||||||||||||||||||
| Other | 284 | |||||||||||||||||||||||||||||||||||||||||||||||||||||||||||||||||||||||||||||||||||||||||||||||||||||||||||||
2003 - 2018 National Fire Incident Reporting System (NFIRS) incidents
- Incident types reported to NFIRS in Bassfield, MS
- 1,19264.2%Fire
- 30316.3%Rescue & EMS
- 19010.2%Service Call
- 794.3%Good Intent Call
- 542.9%Hazardous Condition
- 211.1%False Alarm
- 100.5%Special Incident
- 60.3%Severe Weather
- Fire incident types reported to NFIRS in Bassfield, MS
- 74562.5%Outside Fires
- 29825.0%Structure Fires
- 877.3%Mobile Property/Vehicle Fires
- 625.2%Other
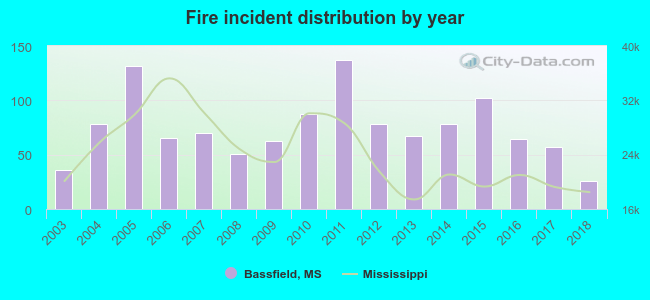 Based on the data from the years 2003 - 2018 the average number of fire incidents per year is 74. The highest number of reported fire incidents - 137 took place in 2011, and the least - 26 in 2018. The data has a declining trend.
 The median response time based on all reported fire incidents is 5 minutes. This is lower compared to the state median value.
The median response time in Bassfield, MS compared to nearest cities:
(Note: Based on data for all years, including only cities with at least 500 fire incidents)
| Bassfield: | 5 minutes |
| Prentiss: | 10 minutes |
| Sumrall: | 9 minutes |
| Collins: | 9 minutes |
| Seminary: | 9 minutes |
| Silver Creek: | 9 minutes |
| Columbia: | 9 minutes |
| Foxworth: | 10 minutes |
| Monticello: | 6 minutes |
 Based on the data from the years 2003 - 2018 the average number of fire-related yearly deaths is 0. The highest number of reported deaths - 2 took place in 2011, and the lowest - 0 in 2003. The data has a constant trend.
 27.3% incidents where reported in the morning and 72.7% in the evening. The most fires (15.4%) took place on Friday, and the least (12.3%) on Wednesday.
 Based on the 1,192 fires from years 2003 - 2018 most fires (13.9%) took place during October, and the least (4.4%) in August.
 Out of all 1,856 cases reported during the years 2003 - 2018, the most belonged to the categories: Fire (64.2%), Rescue & EMS (16.3%), and Service Call (10.2%).
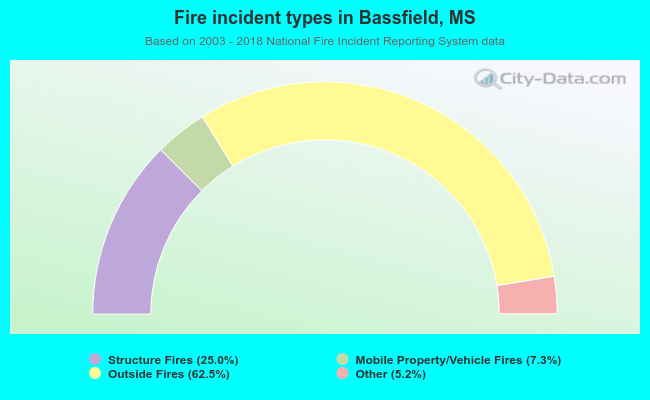 When looking into fire subcategories, the most reports belonged to: Outside Fires (62.5%), and Structure Fires (25.0%).