Battle Ground: Fire Incidents, Indiana (IN)
Where are fire incidents reported in Battle Ground, IN
Something went wrong! Please refresh the page.
|
| |||||||||||||||||||||||||||||||||||||||||||||||||||||||||||||||||||||||||||||||||||||||||||||||||||||||||||||
2002 - 2018 National Fire Incident Reporting System (NFIRS) incidents
- Incident types reported to NFIRS in Battle Ground, IN
- 75749.9%Rescue & EMS
- 40626.7%Fire
- 1369.0%Good Intent Call
- 1248.2%Hazardous Condition
- 442.9%False Alarm
- 352.3%Service Call
- 90.6%Severe Weather
- 70.5%Special Incident
- Fire incident types reported to NFIRS in Battle Ground, IN
- 17242.4%Outside Fires
- 12731.3%Structure Fires
- 8621.2%Mobile Property/Vehicle Fires
- 215.2%Other
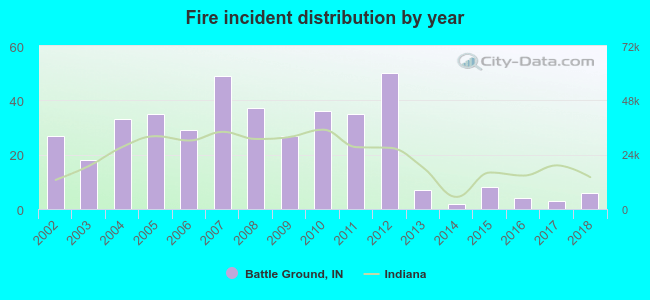 Based on the data from the years 2002 - 2018 the average number of fires per year is 24. The highest number of reported fires - 50 took place in 2012, and the least - 2 in 2014. The data has a declining trend.
 31.5% incidents where reported in the morning and 68.5% in the evening. The most fires (16.0%) took place on Thursday, and the least (12.6%) on Sunday.
 According to the 406 fire incident reports from years 2002 - 2018 most fires (12.8%) took place during March, and the least (4.4%) in January.
 Out of all 1,518 cases reported during the years 2002 - 2018, the most belonged to the categories: Overpressure Rupture (49.9%), Fire (26.7%), and Service Call (9.0%).
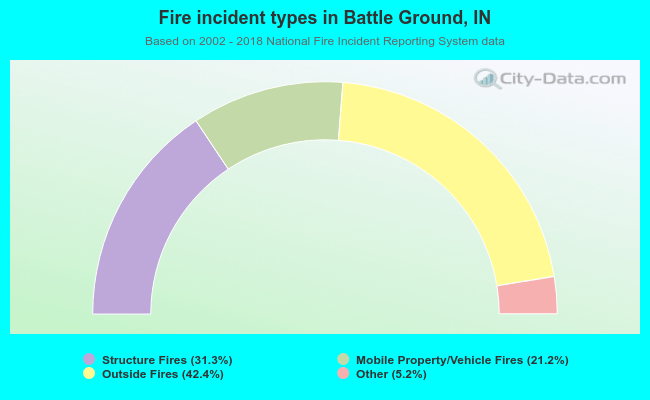 When looking into fire subcategories, the most incidents belonged to: Outside Fires (42.4%), and Structure Fires (31.3%).