Bay: Fire Incidents, Arkansas (AR)
Where are fire incidents reported in Bay, AR
Something went wrong! Please refresh the page.
|
| |||||||||||||||||||||||||||||||||||||||||||||||||||||||||||||||||||||||||||||||||||||||||||||||||||||||||||||
| Other | 46 | |||||||||||||||||||||||||||||||||||||||||||||||||||||||||||||||||||||||||||||||||||||||||||||||||||||||||||||
2002 - 2018 National Fire Incident Reporting System (NFIRS) incidents
- Incident types reported to NFIRS in Bay, AR
- 84861.6%Rescue & EMS
- 39228.5%Fire
- 634.6%Good Intent Call
- 302.2%False Alarm
- 231.7%Service Call
- 151.1%Hazardous Condition
- 60.4%Severe Weather
- Fire incident types reported to NFIRS in Bay, AR
- 18045.9%Outside Fires
- 11529.3%Structure Fires
- 5213.3%Mobile Property/Vehicle Fires
- 4511.5%Other
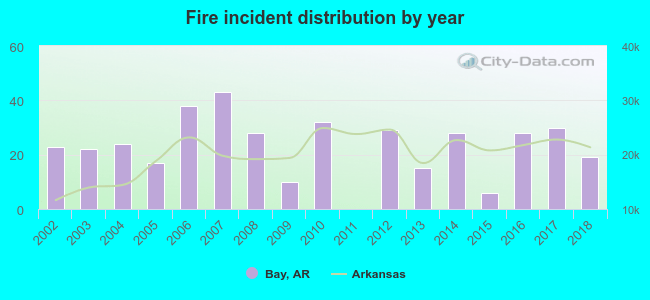 According to the data from the years 2002 - 2018 the average number of fire incidents per year is 23. The highest number of reported fire incidents - 43 took place in 2007, and the least - 0 in 2011. The data has a decreasing trend.
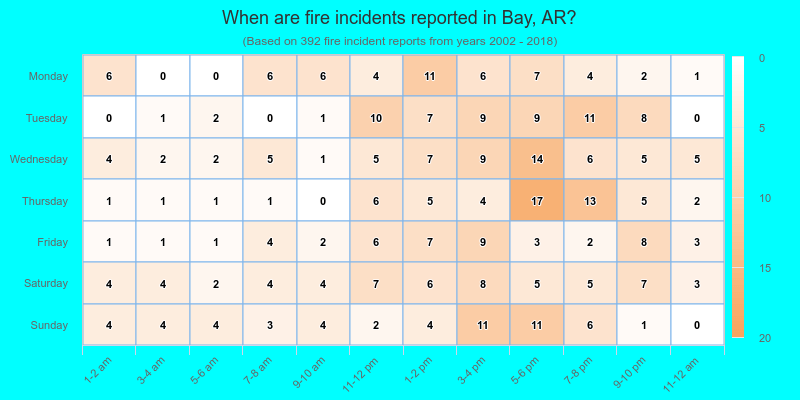
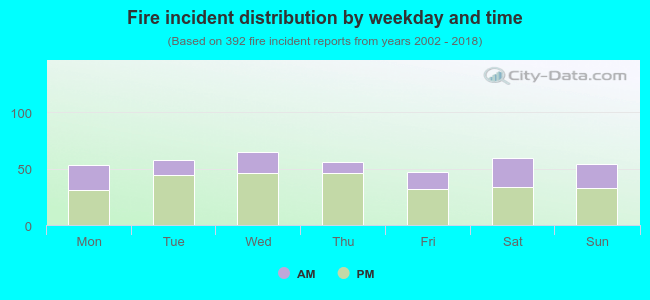 32.1% incidents where reported in the morning and 67.9% in the evening. The most fires (16.6%) took place on Wednesday, and the least (12.0%) on Friday.
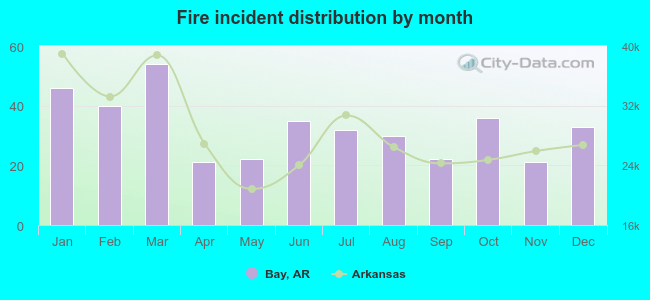 Based on the 392 fire incidents from years 2002 - 2018 most fires (13.8%) took place during March, and the least (5.4%) in April.
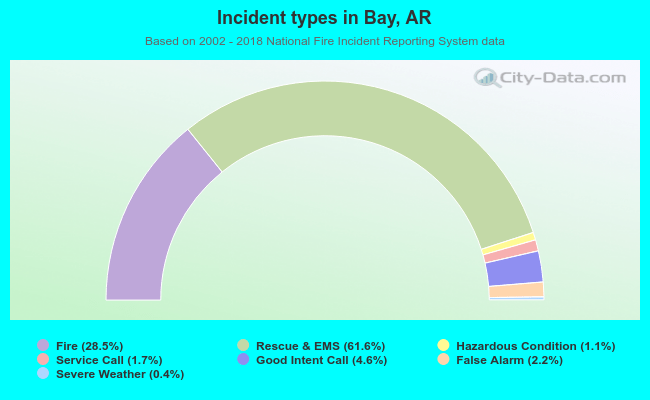 Out of all 1,377 cases reported during the years 2002 - 2018, the most belonged to the categories: Overpressure Rupture (61.6%), Fire (28.5%), and Service Call (4.6%).
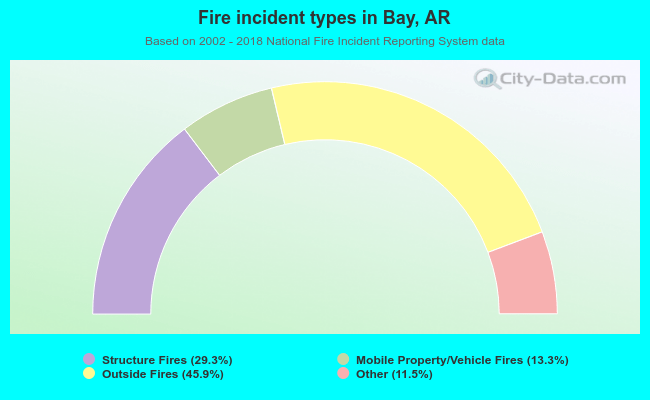 When looking into fire subcategories, the most incidents belonged to: Outside Fires (45.9%), and Structure Fires (29.3%).