| Fire incidents reported |
|---|
| Sreet name | Count |
|---|
| MANCHESTER AVE | 34 | | JUSTUS AVE | 20 | | MAIN ST | 12 | | DOLPHIN | 10 | | DOLPHIN ST | 10 | | 2ND AVE | 8 | | 3RD AVE | 8 | | 7TH AVE | 8 | | CHESNUT RIDGE RD | 8 | | CRESTLINE AVE | 8 | | JOHNSFORD RD | 8 | | PORTLAND AVE | 8 | | STATE ROUTE 212 NW | 8 | | DOLPHIN ST SW | 6 | | LAWNFIELD RD | 6 | | MAIN | 6 | | REDWOOD ST | 6 | | SANDUSKY DR | 6 | | CHESTNUT RIDGE ROAD NW | 4 | | CRESTLINE ST | 4 | | ERIE AVE | 4 | | JOHNSFORD | 4 | | LAWNDELL AVE | 4 | | NAVARRE RD | 4 | | NAVARRE RT62 RD | 4 |
| | | Fire incidents reported |
|---|
| Sreet name | Count |
|---|
| ORCHARD ST | 4 | | ORCHARD ST | 4 | | PINE ST | 4 | | PORTLAND AVE SW | 4 | | SHETLER AVE | 4 | | ST RT 250 | 4 | | STATE ROUTE 250 | 4 | | STATE ROUTE 250 NW | 4 | | STATE ROUTE 93 | 4 | | WATER ST | 4 | | 10026 JOHNSFORD RD | 2 | | 10470 MANCHESTER AVE | 2 | | 10537 ERIE AVE | 2 | | 10600 JOHNSFORD AVE | 2 | | 11115 DOLPHIN AVE | 2 | | 113 SOUTH CHURCH ST | 2 | | 11322 CRESTLINE | 2 | | 11322 CRESTLINE AVE | 2 | | 11569 DOLWAY AVE | 2 | | 12705 SANDUSKY DR | 2 | | 15010 FOXFIELD ST SW | 2 | | 230 WEST MAIN ST | 2 | | 2ND AVE | 2 | | 2ND ST | 2 | | |
|
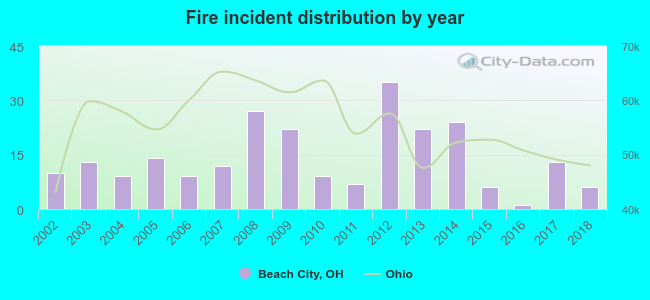 Based on the data from the years 2002 - 2018 the average number of fires per year is 14. The highest number of reported fires - 35 took place in 2012, and the least - 1 in 2016. The data has a declining trend.
 30.1% incidents where reported in the morning and 69.9% in the evening. The most fires (18.0%) took place on Wednesday, and the least (5.9%) on Sunday.
 According to the 239 reports from years 2002 - 2018 most fires (15.9%) took place during April, and the least (5.0%) in May.
 Out of all 1,520 cases reported during the years 2002 - 2018, the most belonged to the categories: Overpressure Rupture (64.7%), Fire (15.7%), and Hazardous Condition (7.2%).
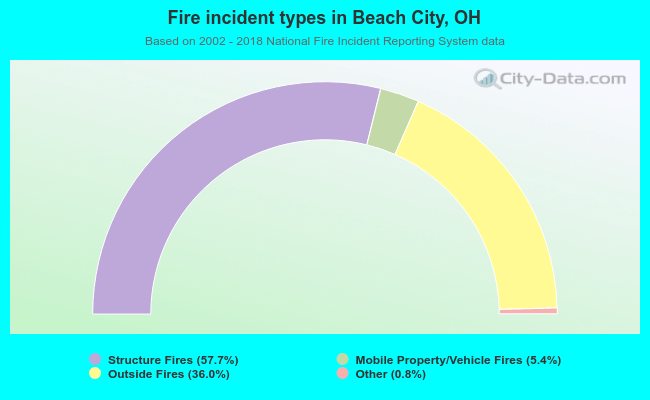 When looking into fire subcategories, the most reports belonged to: Structure Fires (57.7%), and Outside Fires (36.0%).