Beaufort: Fire Incidents, South Carolina (SC)
Where are fire incidents reported in Beaufort, SC
Something went wrong! Please refresh the page.
| Fire incidents reported | |
|---|---|
| Sreet name | Count |
| ROBERT SMALLS PKY | 154 |
| BOUNDARY ST | 86 |
| TRASK PKY | 72 |
| RIBAUT RD | 64 |
| RIBAUT ROAD | 48 |
| SEA ISLAND PKY | 48 |
| PARRIS ISLAND GTWY | 40 |
| SHANKLIN RD | 40 |
| BOUNDARY STREET | 34 |
| SOUTHSIDE BOULEVARD | 34 |
| COUNTY SHED RD | 32 |
| BROAD RIVER BLVD | 30 |
| JOHNNY MORRALL CIRCLE | 28 |
| BAY ST | 26 |
| DUKE ST | 26 |
| OLD SALEM RD | 26 |
| BRUCE K. SMALLS DR | 24 |
| ISLAND TANK RD | 24 |
| PARKER DR | 24 |
| SALEM RD | 24 |
| SOUTHSIDE BLVD | 22 |
| DETOUR RD | 20 |
| MURRAY DR | 20 |
| TALBIRD ROAD | 20 |
| BAY PINES RD | 18 |
| BAY STREET | 18 |
| PINE GROVE RD | 18 |
| ROSEIDA RD | 18 |
| DUKE STREET | 16 |
| PARRIS ISLAND GATEWAY GTWY | 16 |
| Other | 445 |
2004 - 2018 National Fire Incident Reporting System (NFIRS) incidents
- Incident types reported to NFIRS in Beaufort, SC
- 5,54148.3%Rescue & EMS
- 1,51513.2%Fire
- 1,30911.4%Service Call
- 1,27611.1%Hazardous Condition
- 9248.0%False Alarm
- 8807.7%Good Intent Call
- 230.2%Severe Weather
- Fire incident types reported to NFIRS in Beaufort, SC
- 70746.7%Structure Fires
- 53135.0%Outside Fires
- 22715.0%Mobile Property/Vehicle Fires
- 503.3%Other
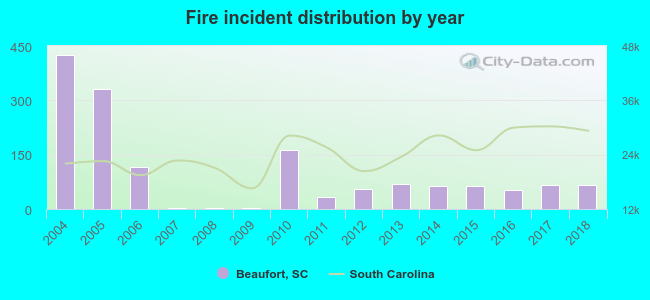 Based on the data from the years 2004 - 2018 the average number of fires per year is 101. The highest number of fires - 425 took place in 2004, and the least - 2 in 2009. The data has a decreasing trend.
The average number of yearly fire incidents per 10k residents in Beaufort, SC compared to nearest cities:
(Note: Based on data for the last 3 years, including only cities with population 5,000 and above)
| Beaufort: | 47.2 |
| Burton: | 31.1 |
| Port Royal: | 17.4 |
| Hilton Head Island: | 31.6 |
| Bluffton: | 95.0 |
| Walterboro: | 425.4 |
| Johns Island: | 104.5 |
| James Island: | 12.7 |
| Charleston: | 56.7 |
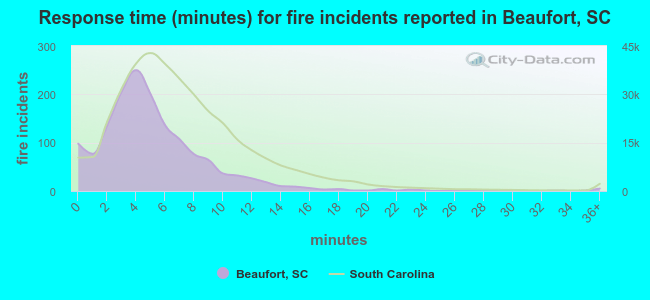 The median response time based on all reported fire incidents is 4 minutes. This is lower than the state median value.
The median response time in Beaufort, SC compared to nearest cities:
(Note: Based on data for all years, including only cities with at least 500 fire incidents)
| Beaufort: | 4 minutes |
| St. Helena: | 6 minutes |
| Ridgeland: | 6 minutes |
| Hilton Head Island: | 6 minutes |
| Bluffton: | 6 minutes |
| Yemassee: | 10 minutes |
| Hardeeville: | 6 minutes |
| Walterboro: | 7 minutes |
| Rincon: | 6 minutes |
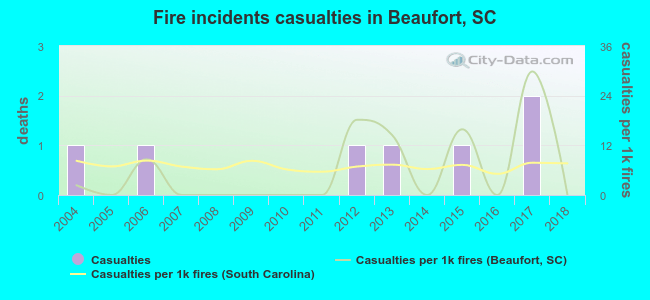 According to the data from the years 2004 - 2018 the average number of fire-related yearly casualties is 0. The highest number of reported casualties - 2 took place in 2017, and the lowest - 0 in 2005. The data has a declining trend.
The average number of injuries per 1,000 fires is 6. This indicator was the highest - 30 in 2017, and the lowest 0 in 2005. The trend for casualties per 1,000 fire incidents is declining. Compared to the state value the number of casualties per 1,000 incidents is lower.
According to the data from the years 2004 - 2018 the average number of fire-related yearly casualties is 0. The highest number of reported casualties - 2 took place in 2017, and the lowest - 0 in 2005. The data has a declining trend.
The average number of injuries per 1,000 fires is 6. This indicator was the highest - 30 in 2017, and the lowest 0 in 2005. The trend for casualties per 1,000 fire incidents is declining. Compared to the state value the number of casualties per 1,000 incidents is lower.Casualties per 1,000 incidents in Beaufort, SC compared to nearest cities:
(Note: Based on data for all years, including only cities with at least 500 fire incidents)
| Beaufort: | 4.6 |
| St. Helena: | 1.7 |
| Ridgeland: | 0.0 |
| Hilton Head Island: | 20.2 |
| Bluffton: | 4.9 |
| Yemassee: | 4.1 |
| Hardeeville: | 3.4 |
| Walterboro: | 17.8 |
| Rincon: | 5.9 |
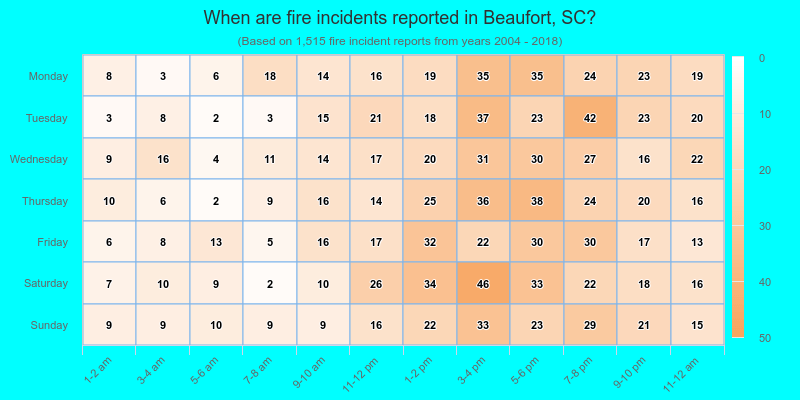
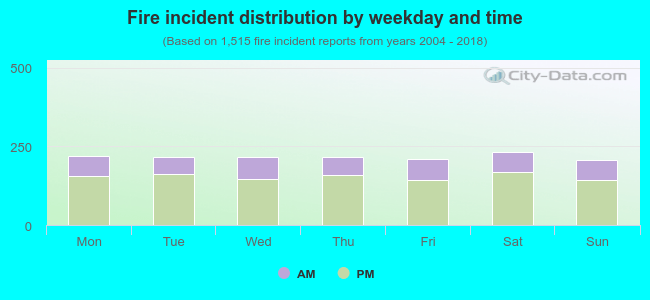 28.8% incidents where reported in the morning and 71.2% in the evening. The most fires (15.4%) took place on Saturday, and the least (13.5%) on Sunday.
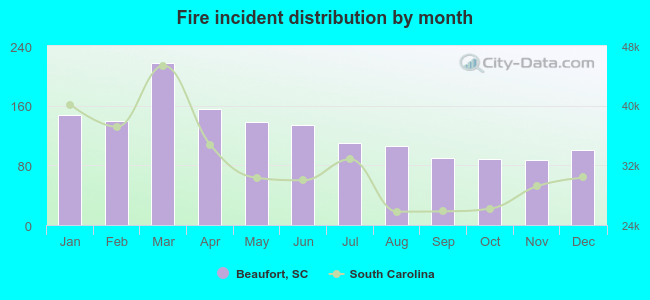 Based on the 1,515 reports from years 2004 - 2018 most fires (14.3%) took place during March, and the least (5.7%) in November.
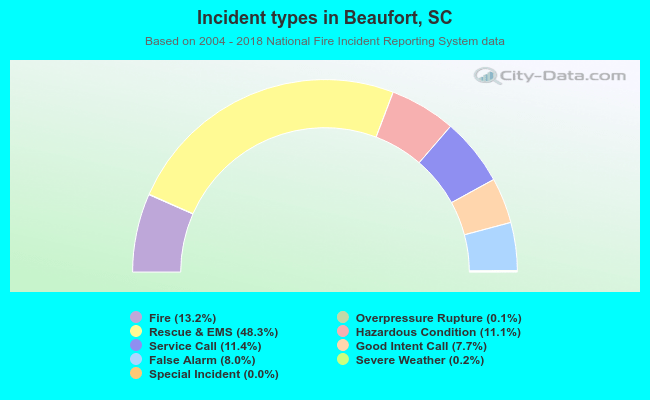 Out of all 11,479 cases reported during the years 2004 - 2018, the most belonged to the categories: Rescue & EMS (48.3%), Fire (13.2%), and Service Call (11.4%).
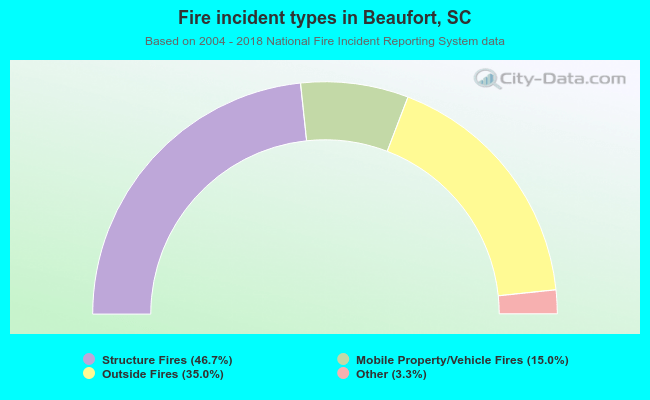 When looking into fire subcategories, the most incidents belonged to: Structure Fires (46.7%), and Outside Fires (35.0%).