| Fire incidents reported |
|---|
| Sreet name | Count |
|---|
| 882 S MAIN ST | 6 | | BEAVER DUMP | 6 | | MM 109 SB I15 FWY | 6 | | 1400 N MAIN ST | 4 | | 2050 N HWY 357 | 4 | | BLUE VALLEY LANE | 4 | | MM 101 NB I15 FWY | 4 | | MM 104 NB I-15 FWY | 4 | | MM 107 HWY 21 | 4 | | MM 107 NB I15 FWY | 4 | | MM 110 SB I-15 FWY | 4 | | MM 112 I-15 FWY | 4 | | MM 112 SB I-15 FWY | 4 | | MM 127 SB I-15 FWY | 4 | | MM 6 HWY 153 HWY | 4 | | MUD FIRE | 4 | | NORTH CREEK RD | 4 | | WEST OF ABE'S MM120 LANE | 4 | | .5 ,MI FROM 153 ON J | 2 | | 1/2ML. N PASS ROAD RD | 2 | | 100 E 1800 N | 2 | | 100 EAST | 2 | | 100 N 100 W ST | 2 | | 100 N 300 E ST | 2 | | 100 W 300 N ST | 2 |
| | | Fire incidents reported |
|---|
| Sreet name | Count |
|---|
| 100N 495E ST | 2 | | 100S 100E ST | 2 | | 100W 1190N ST | 2 | | 102 SB I15 FWY | 2 | | 1083 E 200 N ST | 2 | | 115 W CENTER ST | 2 | | 1175 E CENTER ST | 2 | | 126 SB I15 | 2 | | 1265 N 300W ST | 2 | | 1265 N HWY 357 HWY | 2 | | 1265N HWY 357 HWY | 2 | | 1275 N 300 W ST | 2 | | 1300W 1400N ST | 2 | | 135W 1250N ST | 2 | | 1395N HWY 357 HWY | 2 | | 1400 N HWY 357 HWY | 2 | | 1400 S 600 W ST | 2 | | 142 N 1370 E ST | 2 | | 145 W 500 N ST | 2 | | 15 W 200 S ST | 2 | | 1500 N 300 W ST | 2 | | 1500E 200N ST | 2 | | 160S MAIN ST | 2 | | 175 W CENTER ST | 2 | | 177 EAST 100 NORTH ST | 2 |
|
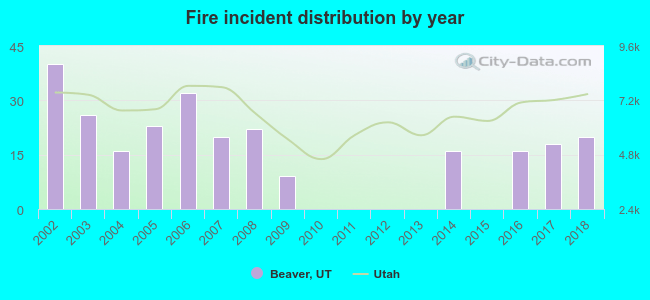 According to the data from the years 2002 - 2018 the average number of fires per year is 15. The highest number of reported fire incidents - 40 took place in 2002, and the least - 0 in 2010. The data has a decreasing trend.
 24.8% incidents where reported in the morning and 75.2% in the evening. The most fires (18.2%) took place on Tuesday, and the least (11.2%) on Wednesday.
 According to the 258 reports from years 2002 - 2018 most fires (20.2%) took place during July, and the least (3.1%) in December.
 Out of all 729 cases reported during the years 2002 - 2018, the most belonged to the categories: Overpressure Rupture (37.7%), Fire (35.4%), and Rescue & EMS (13.0%).
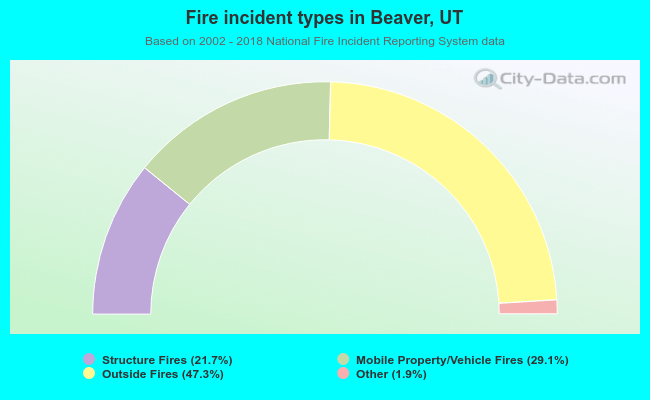 When looking into fire subcategories, the most reports belonged to: Outside Fires (47.3%), and Mobile Property/Vehicle Fires (29.1%).