Belfast: Fire Incidents, New York (NY)
Where are fire incidents reported in Belfast, NY
Something went wrong! Please refresh the page.
|
| |||||||||||||||||||||||||||||||||||||||||||||||||||||||||||||||||||||||||||||||||||||||||||||||||||||||||
2002 - 2018 National Fire Incident Reporting System (NFIRS) incidents
- Incident types reported to NFIRS in Belfast, NY
- 12624.1%Rescue & EMS
- 11922.8%Fire
- 9718.5%Hazardous Condition
- 7614.5%Service Call
- 5310.1%Good Intent Call
- 265.0%False Alarm
- 163.1%Severe Weather
- 91.7%Special Incident
- 10.2%Overpressure Rupture
- Fire incident types reported to NFIRS in Belfast, NY
- 5747.9%Structure Fires
- 3932.8%Outside Fires
- 1916.0%Mobile Property/Vehicle Fires
- 43.4%Other
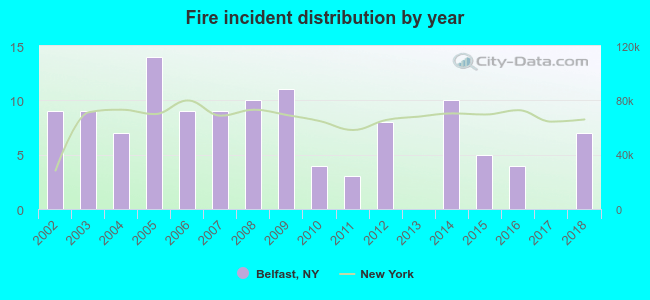 Based on the data from the years 2002 - 2018 the average number of fire incidents per year is 7. The highest number of fires - 14 took place in 2005, and the least - 0 in 2013. The data has a dropping trend.
 31.9% incidents where reported in the morning and 68.1% in the evening. The most fires (23.5%) took place on Monday, and the least (10.1%) on Sunday.
 According to the 119 fire incidents from years 2002 - 2018 most fires (20.2%) took place during April, and the least (3.4%) in November.
 Out of all 523 cases reported during the years 2002 - 2018, the most belonged to the categories: Rescue & EMS (24.1%), Fire (22.8%), and Hazardous Condition (18.5%).
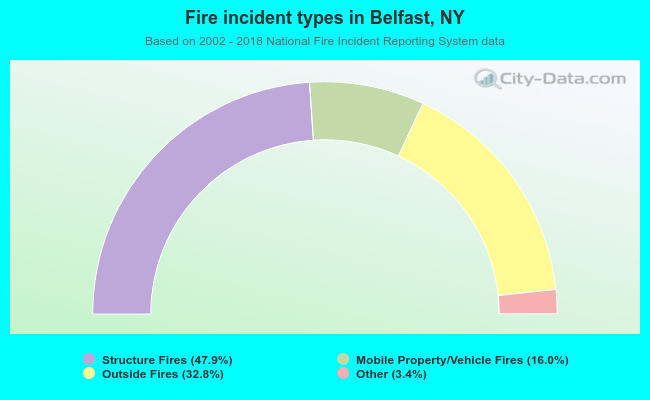 When looking into fire subcategories, the most incidents belonged to: Structure Fires (47.9%), and Outside Fires (32.8%).