| Fire incidents reported |
|---|
| Sreet name | Count |
|---|
| LANKFORD HWY | 30 | | SAVAGETOWN RD | 26 | | KING ST | 24 | | SHIELDS BRIDGE RD | 22 | | BELLE HAVEN RD | 18 | | SEASIDE RD | 12 | | COUNTY LINE RD | 10 | | LEE ST | 10 | | BLUFF DR | 8 | | INDIAN TRAIL RD | 8 | | MERRY CAT LN | 8 | | AZALEA FARM RD | 4 | | BELLE HAVEN ROAD | 4 | | BELLS NECK RD | 4 | | BIG PINE RD | 4 | | COUNTRY LINE RD | 4 | | DOGWOOD LN | 4 | | INDIAN LN | 4 | | KING STREET | 4 | | ADDISON | 2 | | ADDISON LN | 2 | | AZALEA FARM RD | 2 | | AZELIA FARM RD | 2 | | BELLS NECK ROAD | 2 |
| | | Fire incidents reported |
|---|
| Sreet name | Count |
|---|
| BENDING STREAM DR | 2 | | BIRDS MILL RD | 2 | | BYRDS MILL RD | 2 | | DAVIS WHARF RD | 2 | | EASTFIELD DR | 2 | | FINNEY LN | 2 | | GLEBE FARM RD | 2 | | INDIAN LA | 2 | | INDIAN LANE | 2 | | INDIAN ST | 2 | | KING ST | 2 | | LANKFORD HIGHWAY | 2 | | LEE | 2 | | MERRY CAT LA | 2 | | MILL POINT LN | 2 | | NORTH WAY | 2 | | PHEASANT RUN DR | 2 | | SAVAGE TOWN RD | 2 | | SHIELD BRIDGE RD | 2 | | SHIELDS BRIDGE RD | 2 | | TOWER WAY | 2 | | TURNER ST | 2 | | WINDINGDALE LN | 2 | | |
|
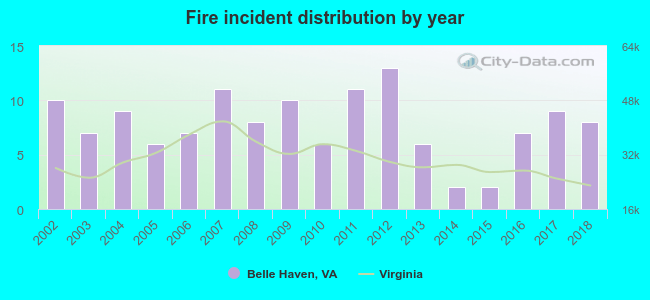 Based on the data from the years 2002 - 2018 the average number of fires per year is 8. The highest number of reported fires - 13 took place in 2012, and the least - 2 in 2014. The data has a dropping trend.
 36.4% incidents where reported in the morning and 63.6% in the evening. The most fires (20.5%) took place on Saturday, and the least (9.8%) on Wednesday.
 Based on the 132 fire incident reports from years 2002 - 2018 most fires (14.4%) took place during April, and the least (2.3%) in June.
 Out of all 721 cases reported during the years 2002 - 2018, the most belonged to the categories: Overpressure Rupture (37.0%), Rescue & EMS (35.1%), and Fire (18.3%).
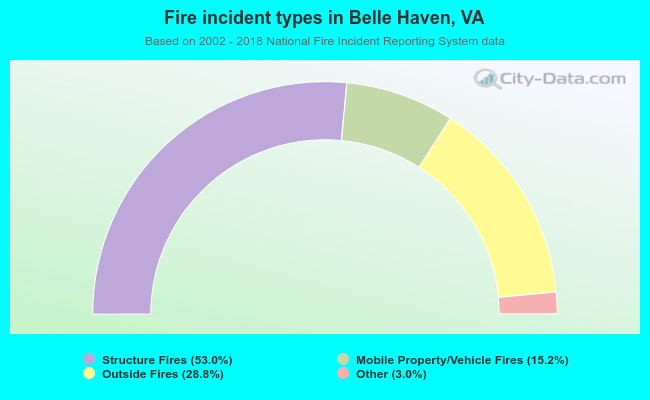 When looking into fire subcategories, the most reports belonged to: Structure Fires (53.0%), and Outside Fires (28.8%).