| Fire incidents reported |
|---|
| Sreet name | Count |
|---|
| COUNTY ROUTE 601 | 10 | | ROUTE 206 | 10 | | BRIDGEPOINT RD | 8 | | BROADWAY | 8 | | CAIN CT | 8 | | REID AVE | 8 | | RT 206 | 8 | | COUNTY ROUTE 533 | 6 | | HARLINGEN ROAD | 6 | | LABAW WAY | 6 | | SUNSET RD | 6 | | TOWNSHIP LINE RD | 6 | | WELLINGTON COURT | 6 | | CAIN CT | 4 | | CATSKILL COURT | 4 | | CHARLESTON DR | 4 | | COUNTY ROUTE 601 HWY | 4 | | CTY RT 533 | 4 | | DEAD TREE RUN ROAD | 4 | | DOMINICUS CT | 4 | | DUTCHTOWN ZION RD | 4 | | ELLIS DR | 4 | | HEATHER LANE | 4 | | MONROE AVE | 4 | | MONTGOMERY PARK | 4 |
| | | Fire incidents reported |
|---|
| Sreet name | Count |
|---|
| MONTGOMERY RD | 4 | | MUIRHEAD CT | 4 | | ORCHARD RD | 4 | | PRIMROSE CT | 4 | | RIVER RD | 4 | | RIVER ROAD | 4 | | ROUTE 533 | 4 | | RT 518 | 4 | | RT 601 | 4 | | SPRING HILL ROAD | 4 | | SYMES DR | 4 | | US HWY 206 | 4 | | US HWY 206 HWY | 4 | | WELLINGTON CT | 4 | | 1009 PRIMROSE | 2 | | 1131 RT 601 | 2 | | 12 SILVERTHORN LANE | 2 | | 1405 TAGGERT DR | 2 | | 16 HAMPTON CT | 2 | | 1601 TAGGERT DRIVE | 2 | | 1606 TAGGERT DRIVE | 2 | | 17 CREEKVIEW CT | 2 | | 172 MONROE AVE | 2 | | 1743 RT 206 | 2 | | |
|
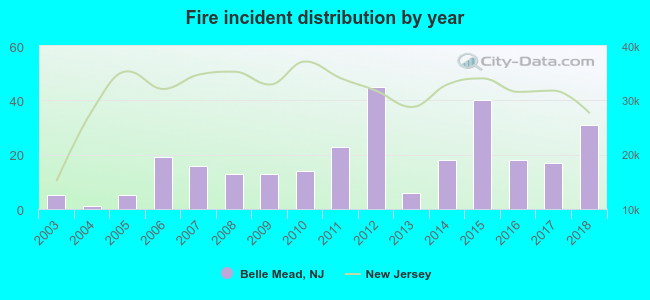 According to the data from the years 2003 - 2018 the average number of fire incidents per year is 18. The highest number of fires - 45 took place in 2012, and the least - 1 in 2004. The data has an increasing trend.
 27.5% incidents where reported in the morning and 72.5% in the evening. The most fires (15.5%) took place on Saturday, and the least (11.3%) on Tuesday.
 Based on the 284 incident reports from years 2003 - 2018 most fires (11.3%) took place during January, and the least (3.9%) in August.
 Out of all 1,311 cases reported during the years 2003 - 2018, the most belonged to the categories: Hazardous Condition (29.7%), False Alarm (27.2%), and Fire (21.7%).
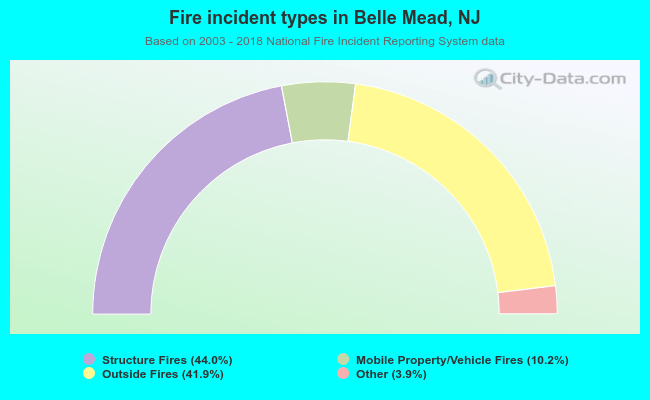 When looking into fire subcategories, the most reports belonged to: Structure Fires (44.0%), and Outside Fires (41.9%).