| Fire incidents reported |
|---|
| Sreet name | Count |
|---|
| HWY 28 | 12 | | COUNTY ROAD 450 | 8 | | 34069 CO RD 409 | 6 | | HIGHWAY 28 | 6 | | HWY 42 | 6 | | 173 SUMMER LN | 4 | | 20945 HWY 42 | 4 | | 21205 HWY 42 | 4 | | 7485 HWY 89 S | 4 | | HIGHWAY 42 | 4 | | HWY 28 W | 4 | | MILDRED MILE LN | 4 | | PARKVIEW | 4 | | 1.5 MILES WEST OF 42 ON HWY 28 | 2 | | 108 S ALAVRADO | 2 | | 1102 HWY 28 | 2 | | 1174 COUNTY ROAD 754 | 2 | | 17308 HWY 42 | 2 | | 17517 CR 308 | 2 | | 18861 CR 318 | 2 | | 1924 HWY Y | 2 | | 1941 HWY Y | 2 | | 19637 HWY 42E | 2 | | 200 5TH STREET | 2 | | 200 E HWY 28 E | 2 |
| | | Fire incidents reported |
|---|
| Sreet name | Count |
|---|
| 200 N. ALVERADO | 2 | | 20038 HWY 42 EAST | 2 | | 201 N ALVARDO | 2 | | 20261 COUNTY ROAD 315 | 2 | | 20385 HWY 42 | 2 | | 20625 | 2 | | 20895 CO RD 310 | 2 | | 20934 CO RD 309 | 2 | | 20947 HWY 42 | 2 | | 21195 HWY 42 EAST | 2 | | 212 S LINN AVE | 2 | | 21612 MARIES RD 337 | 2 | | 22168 HWY C | 2 | | 22309 MARIES RD 417 | 2 | | 22524 CR 409 | 2 | | 248 OSAGE RD 722 | 2 | | 2771 HWY Y | 2 | | 28 HWY | 2 | | 300 N. ALVERADO | 2 | | 300 S ALVARADO AVE | 2 | | 30402 CR 317 | 2 | | 308 COUNTY RD | 2 | | 31502 CR 316 | 2 | | 31748 HWY 28 | 2 | | |
|
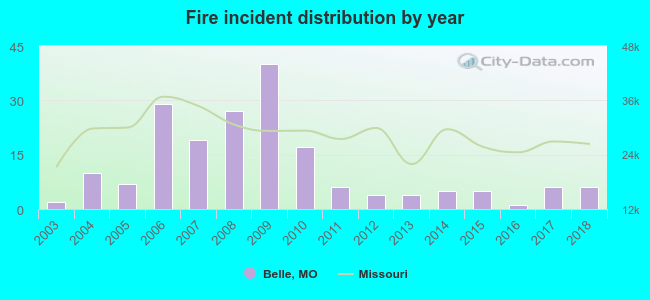 Based on the data from the years 2003 - 2018 the average number of fire incidents per year is 12. The highest number of fire incidents - 40 took place in 2009, and the least - 1 in 2016. The data has an increasing trend.
 32.4% incidents where reported in the morning and 67.6% in the evening. The most fires (19.1%) took place on Saturday, and the least (11.2%) on Monday.
 According to the 188 fire incidents from years 2003 - 2018 most fires (21.8%) took place during March, and the least (3.7%) in May.
 Out of all 270 cases reported during the years 2003 - 2018, the most belonged to the categories: Fire (69.6%), Rescue & EMS (25.2%), and Service Call (2.6%).
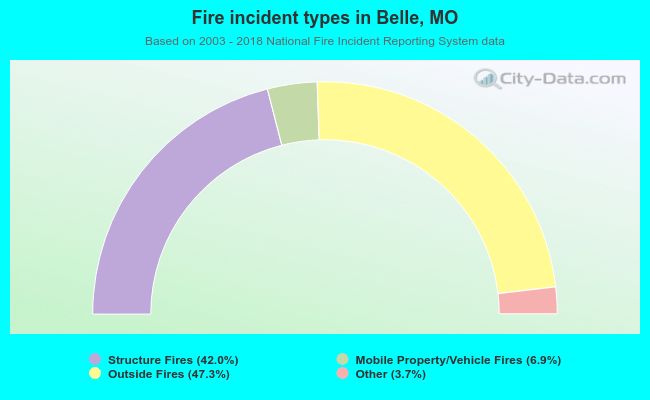 When looking into fire subcategories, the most incidents belonged to: Outside Fires (47.3%), and Structure Fires (42.0%).