Bellevue: Fire Incidents, Wisconsin (WI)
Where are fire incidents reported in Bellevue, WI
Something went wrong! Please refresh the page.
|
| |||||||||||||||||||||||||||||||||||||||||||||||||||||||||||||||||||||||||||||||||||||||||||||||||||||||||||||
2006 - 2018 National Fire Incident Reporting System (NFIRS) incidents
- Incident types reported to NFIRS in Bellevue, WI
- 1,61157.9%Rescue & EMS
- 38113.7%Good Intent Call
- 2418.7%Fire
- 2288.2%False Alarm
- 1846.6%Service Call
- 1284.6%Hazardous Condition
- 30.1%Overpressure Rupture
- Fire incident types reported to NFIRS in Bellevue, WI
- 17673.0%Structure Fires
- 3213.3%Outside Fires
- 2510.4%Mobile Property/Vehicle Fires
- 83.3%Other
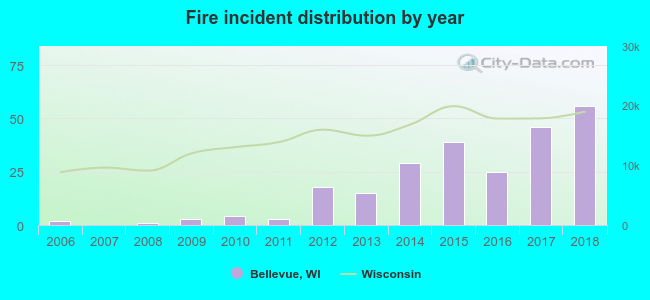 Based on the data from the years 2006 - 2018 the average number of fires per year is 19. The highest number of reported fire incidents - 56 took place in 2018, and the least - 0 in 2007. The data has a rising trend.
The average number of yearly fire incidents per 10k residents in Bellevue, WI compared to nearest cities:
(Note: Based on data for the last 3 years, including only cities with population 5,000 and above)
| Bellevue: | 27.8 |
| Ledgeview: | 4.6 |
| Allouez: | 0.7 |
| Green Bay: | 22.1 |
| De Pere: | 19.3 |
| Ashwaubenon: | 9.0 |
| Howard: | 11.4 |
| Hobart: | 5.1 |
| Suamico: | 9.5 |

 34.0% incidents where reported in the morning and 66.0% in the evening. The most fires (17.4%) took place on Thursday, and the least (12.4%) on Sunday.
 According to the 241 fire incident reports from years 2006 - 2018 most fires (10.8%) took place during January, and the least (3.7%) in September.
 Out of all 2,780 cases reported during the years 2006 - 2018, the most belonged to the categories: Rescue & EMS (57.9%), Good Intent Call (13.7%), and Fire (8.7%).
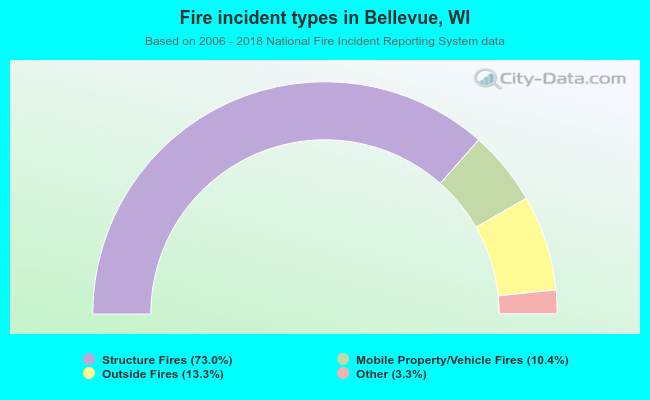 When looking into fire subcategories, the most reports belonged to: Structure Fires (73.0%), and Outside Fires (13.3%).