Bellflower: Fire Incidents, California (CA)
Where are fire incidents reported in Bellflower, CA
Something went wrong! Please refresh the page.
| Fire incidents reported | |
|---|---|
| Sreet name | Count |
| ARTESIA | 188 |
| ALONDRA | 142 |
| BELLFLOWER | 138 |
| LAKEWOOD | 132 |
| WOODRUFF | 126 |
| PARK | 104 |
| ROSECRANS | 100 |
| EUCALYPTUS | 98 |
| CEDAR | 84 |
| CLARK | 72 |
| RAMONA | 72 |
| CORNUTA | 68 |
| FLORA VISTA | 62 |
| SOMERSET | 60 |
| ROSE | 54 |
| MC NAB | 48 |
| OAK | 46 |
| FLOWER | 44 |
| LAKEWOOD BLVD91 | 44 |
| PALM | 38 |
| EB 91 AT LAKEWOOD | 30 |
| BELMONT | 28 |
| RYON | 26 |
| VIRGINIA | 24 |
| WALNUT | 24 |
| CARFAX | 22 |
| EB 91 AT BELLFLOWER | 22 |
| IVES | 22 |
| LOS ANGELES | 22 |
| WB 91 AT LAKEWOOD | 20 |
2005 - 2018 National Fire Incident Reporting System (NFIRS) incidents
- Incident types reported to NFIRS in Bellflower, CA
- 20,15573.4%Rescue & EMS
- 2,6639.7%Good Intent Call
- 1,6776.1%False Alarm
- 1,3645.0%Fire
- 8733.2%Hazardous Condition
- 6662.4%Service Call
- Fire incident types reported to NFIRS in Bellflower, CA
- 53439.1%Outside Fires
- 46133.8%Structure Fires
- 29621.7%Mobile Property/Vehicle Fires
- 735.4%Other
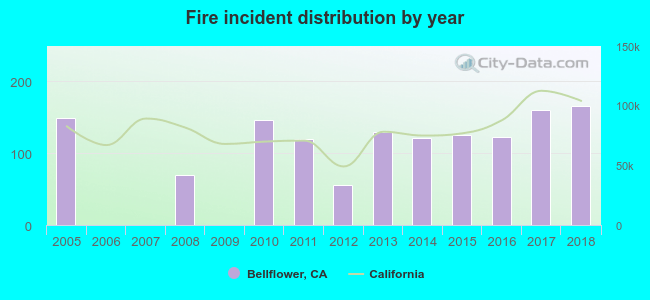 Based on the data from the years 2005 - 2018 the average number of fires per year is 97. The highest number of reported fire incidents - 166 took place in 2018, and the least - 0 in 2006. The data has a growing trend.
The average number of yearly fire incidents per 10k residents in Bellflower, CA compared to nearest cities:
(Note: Based on data for the last 3 years, including only cities with population 5,000 and above)
| Bellflower: | 19.1 |
| Paramount: | 19.3 |
| Norwalk: | 12.2 |
| Lakewood: | 12.0 |
| Artesia: | 14.4 |
| Downey: | 13.6 |
| Cerritos: | 14.6 |
| Santa Fe Springs: | 47.1 |
| Lynwood: | 19.4 |
 The median response time based on all reported fire incidents is 4 minutes. This is lower than the California median value.
The median response time in Bellflower, CA compared to nearest cities:
(Note: Based on data for all years, including only cities with at least 500 fire incidents)
| Bellflower: | 4 minutes |
| Paramount: | 5 minutes |
| Norwalk: | 5 minutes |
| Lakewood: | 4 minutes |
| Downey: | 7 minutes |
| Cerritos: | 5 minutes |
| Santa Fe Springs: | 7 minutes |
| Lynwood: | 4 minutes |
| South Gate: | 5 minutes |
 33.0% incidents where reported in the morning and 67.0% in the evening. The most fires (16.2%) took place on Thursday, and the least (13.3%) on Wednesday.
 Based on the 1,364 reports from years 2005 - 2018 most fires (12.5%) took place during January, and the least (6.8%) in March.
 Out of all 27,449 cases reported during the years 2005 - 2018, the most belonged to the categories: Rescue & EMS (73.4%), Good Intent Call (9.7%), and False Alarm (6.1%).
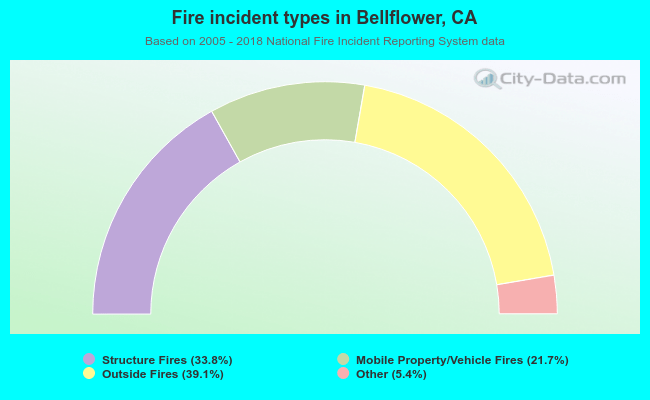 When looking into fire subcategories, the most incidents belonged to: Outside Fires (39.1%), and Structure Fires (33.8%).