Belvidere: Fire Incidents, New Jersey (NJ)
Where are fire incidents reported in Belvidere, NJ
Something went wrong! Please refresh the page.
|
| |||||||||||||||||||||||||||||||||||||||||||||||||||||||||||||||||||||||||||||||||||||||||||||||||||||||||||||
2004 - 2018 National Fire Incident Reporting System (NFIRS) incidents
- Incident types reported to NFIRS in Belvidere, NJ
- 50428.9%Hazardous Condition
- 48227.7%Fire
- 27916.0%Rescue & EMS
- 22212.8%False Alarm
- 1327.6%Good Intent Call
- 744.3%Service Call
- 442.5%Overpressure Rupture
- 40.2%Severe Weather
- Fire incident types reported to NFIRS in Belvidere, NJ
- 28659.3%Structure Fires
- 13528.0%Outside Fires
- 316.4%Mobile Property/Vehicle Fires
- 306.2%Other
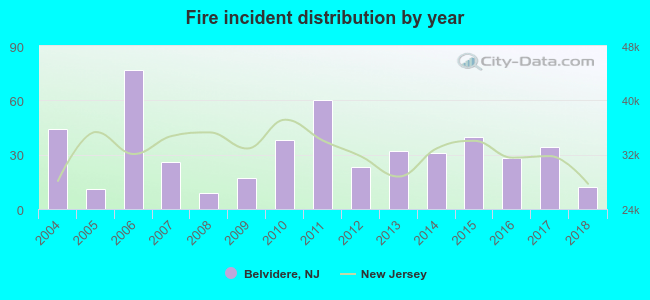 According to the data from the years 2004 - 2018 the average number of fires per year is 32. The highest number of reported fires - 77 took place in 2006, and the least - 9 in 2008. The data has a declining trend.
 32.6% incidents where reported in the morning and 67.4% in the evening. The most fires (17.4%) took place on Sunday, and the least (11.2%) on Friday.
 Based on the 482 fires from years 2004 - 2018 most fires (11.8%) took place during December, and the least (6.0%) in January.
 Out of all 1,741 cases reported during the years 2004 - 2018, the most belonged to the categories: Hazardous Condition (28.9%), Fire (27.7%), and Rescue & EMS (16.0%).
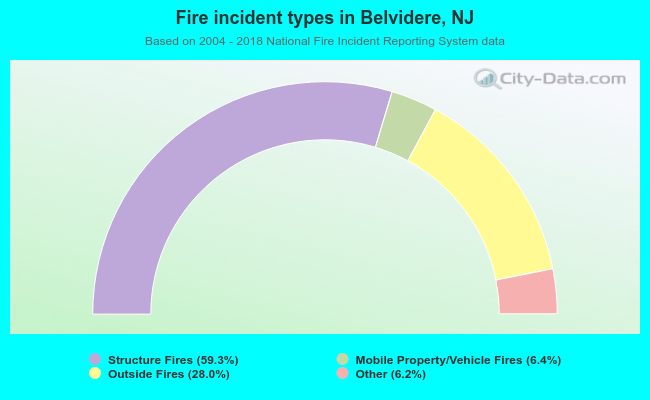 When looking into fire subcategories, the most incidents belonged to: Structure Fires (59.3%), and Outside Fires (28.0%).