| Fire incidents reported |
|---|
| Sreet name | Count |
|---|
| BROADWAY | 14 | | CAMP CREEK ROAD | 12 | | LOST CREEK | 12 | | ONAGA ROAD | 12 | | OLIVE ST | 6 | | US HIGHWAY 24 | 6 | | HWY 24 | 4 | | HWY 24 ONAGA RD. | 4 | | JEFFREY ENERGY CENTER | 4 | | NOBLE | 4 | | OLIVE | 4 | | OREGON TRAIL RD | 4 | | OREGON TRAIL ROAD | 4 | | PAXICO RD | 4 | | WELCH RD. RD | 4 | | 11015 ONAGA RD. | 2 | | 15863 MILITARY TRAIL RD | 2 | | 20855 SCHOOL VIEW RD. | 2 | | 2115 INDIAN TRAIL RD. | 2 | | 22310 HALF MOON RD | 2 | | 22705 OREGON TRAIL RD. | 2 | | 22855 HIGHWAY 24 | 2 | | 25905 JEFFREY ROAD | 2 | | 305 BROADWAY | 2 | | 3RD ST | 2 |
| | | Fire incidents reported |
|---|
| Sreet name | Count |
|---|
| 6285 PLEASANT VIEW RD | 2 | | 7855 ONAGA ROAD RD | 2 | | ANDERSON | 2 | | BROADWAY RD | 2 | | CAMP CREEK | 2 | | CAMP CREEK RD | 2 | | CAMP CREEK RD | 2 | | CAMP REEK RD | 2 | | CAMPCREEK | 2 | | CONESTOGA | 2 | | DARLING ROAD | 2 | | DOGWOOD RD | 2 | | DUTCH MILL RD. | 2 | | EMMETT RD | 2 | | GREENWOOD RD | 2 | | HIGHWAY 63 | 2 | | HWY 24 & JENN | 2 | | HWY 24 CAMP CREEK RD | 2 | | HWY 24 PEDDICORD ROAD RD | 2 | | HWY 99 ALMA HWY | 2 | | INDIAN HILLS ROAD | 2 | | INDIAN VILLAGE | 2 | | JAMES AND OREGON TRAIL RD | 2 | | JAMES RD | 2 | | |
|
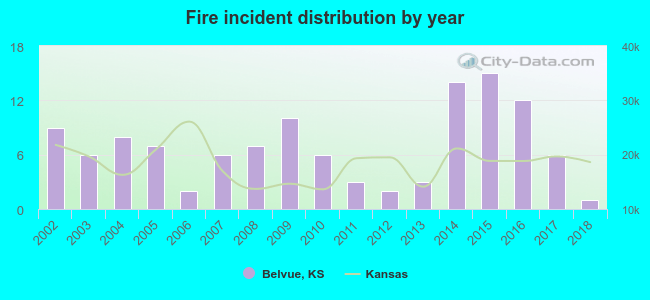 According to the data from the years 2002 - 2018 the average number of fires per year is 7. The highest number of fires - 15 took place in 2015, and the least - 1 in 2018. The data has a decreasing trend.
 22.2% incidents where reported in the morning and 77.8% in the evening. The most fires (20.5%) took place on Saturday, and the least (6.8%) on Wednesday.
 Based on the 117 fire incident reports from years 2002 - 2018 most fires (23.1%) took place during April, and the least (1.7%) in December.
 Out of all 192 cases reported during the years 2002 - 2018, the most belonged to the categories: Fire (60.9%), Rescue & EMS (24.5%), and Good Intent Call (6.3%).
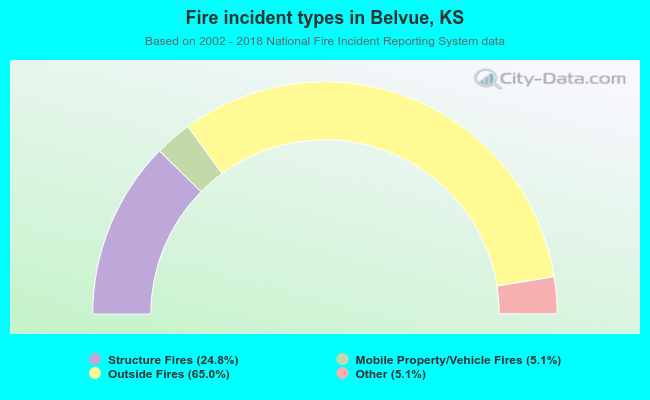 When looking into fire subcategories, the most reports belonged to: Outside Fires (65.0%), and Structure Fires (24.8%).