Bemidji: Fire Incidents, Minnesota (MN)
Where are fire incidents reported in Bemidji, MN
Something went wrong! Please refresh the page.
| Fire incidents reported | |
|---|---|
| Sreet name | Count |
| PAUL BUNYAN DR | 148 |
| IRVINE AVE | 138 |
| BEMIDJI AVE | 84 |
| ROOSEVELT RD | 82 |
| 15TH ST | 68 |
| MINNESOTA AVE | 66 |
| BIRCHMONT DR | 60 |
| US HIGHWAY 2 | 60 |
| DIVISION ST | 52 |
| 30TH ST | 50 |
| US HIGHWAY 71 | 50 |
| 5TH ST | 48 |
| AMERICA AVE | 42 |
| BELTRAMI AVE | 36 |
| LAKE AVE | 34 |
| CARDINAL RD | 32 |
| 4TH ST | 30 |
| BALSAM RD | 30 |
| 1ST ST | 28 |
| BIRCHMONT BEACH RD | 28 |
| ANNE ST | 26 |
| ECKLES RD | 26 |
| GRANGE RD | 26 |
| 26TH ST | 24 |
| DELTON AVE | 24 |
| PARK AVE | 24 |
| 23RD ST | 22 |
| 3RD ST | 22 |
| BECIDA RD | 22 |
| HUB CO RD 9 | 22 |
| Other | 400 |
2002 - 2018 National Fire Incident Reporting System (NFIRS) incidents
- Incident types reported to NFIRS in Bemidji, MN
- 3,54032.3%Service Call
- 3,41431.2%Rescue & EMS
- 1,80416.5%Fire
- 9458.6%Hazardous Condition
- 8848.1%False Alarm
- 3062.8%Good Intent Call
- 280.3%Overpressure Rupture
- 220.2%Special Incident
- Fire incident types reported to NFIRS in Bemidji, MN
- 77843.1%Structure Fires
- 63135.0%Outside Fires
- 34118.9%Mobile Property/Vehicle Fires
- 543.0%Other
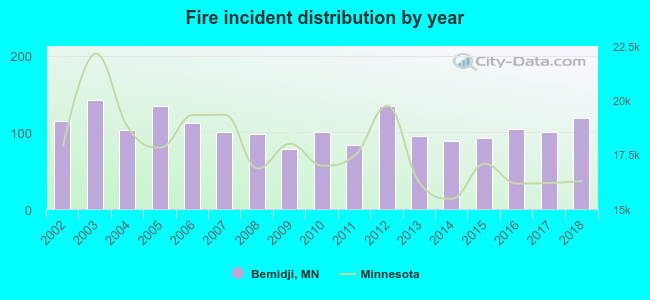 According to the data from the years 2002 - 2018 the average number of fires per year is 106. The highest number of reported fire incidents - 142 took place in 2003, and the least - 78 in 2009. The data has a growing trend.
The average number of yearly fire incidents per 10k residents in Bemidji, MN compared to nearest cities:
(Note: Based on data for the last 3 years, including only cities with population 5,000 and above)
| Bemidji: | 75.0 |
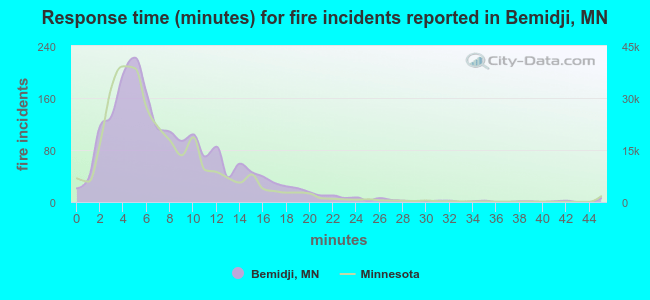 The median response time based on all reported fire incidents is 7 minutes. This is about the same as the Minnesota median value.
The median response time in Bemidji, MN compared to nearest cities:
(Note: Based on data for all years, including only cities with at least 500 fire incidents)
| Bemidji: | 7 minutes |
| Park Rapids: | 9 minutes |
| Deer River: | 11 minutes |
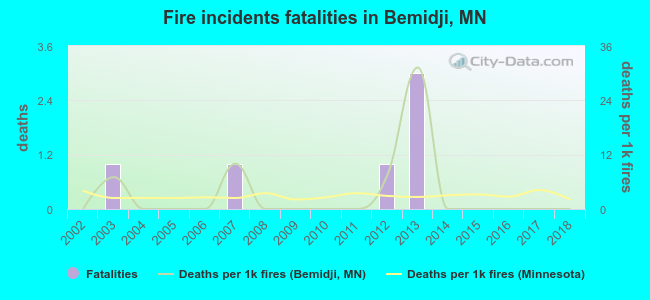 Based on the reports from the years 2002 - 2018 the average number of fire-related fatalities per year is 0. The highest number of deaths - 3 took place in 2013, and the lowest - 0 in 2002. The data has a constant trend.
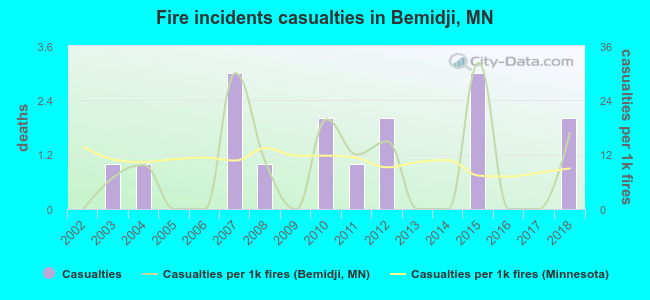 Based on the reports from the years 2002 - 2018 the average number of fire-related casualties per year is 1. The highest number of casualties - 3 took place in 2007, and the lowest - 0 in 2002. The data has a growing trend.
The average number of casualties per 1,000 fires is 9. This indicator was the highest - 32 in 2015, and the lowest 0 in 2002. The trend for casualties per 1,000 fires is increasing. Compared to the Minnesota value the number of casualties per 1,000 fire incidents is similar.
Based on the reports from the years 2002 - 2018 the average number of fire-related casualties per year is 1. The highest number of casualties - 3 took place in 2007, and the lowest - 0 in 2002. The data has a growing trend.
The average number of casualties per 1,000 fires is 9. This indicator was the highest - 32 in 2015, and the lowest 0 in 2002. The trend for casualties per 1,000 fires is increasing. Compared to the Minnesota value the number of casualties per 1,000 fire incidents is similar.Casualties per 1,000 incidents in Bemidji, MN compared to nearest cities:
(Note: Based on data for all years, including only cities with at least 500 fire incidents)
| Bemidji: | 8.9 |
| Park Rapids: | 4.1 |
| Deer River: | 0.0 |
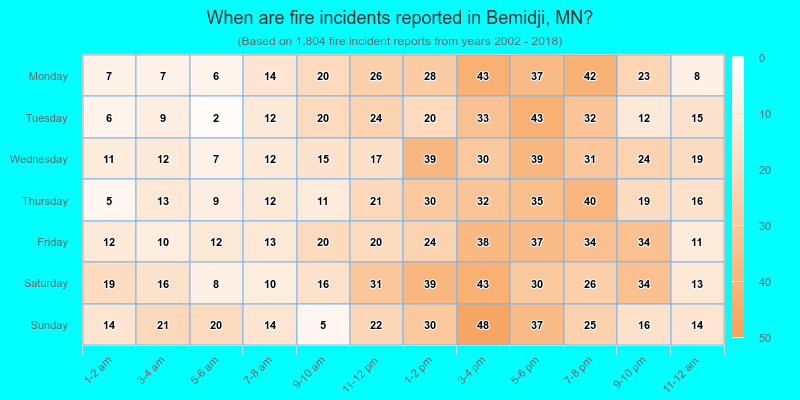
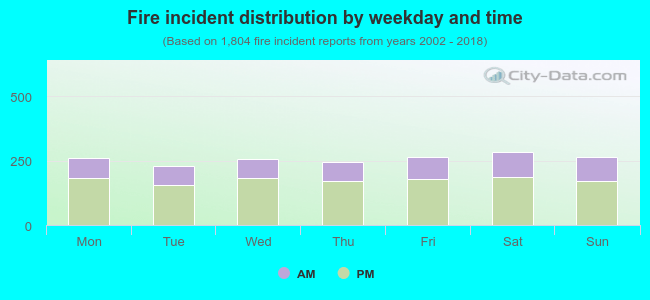 32.2% incidents where reported in the morning and 67.8% in the evening. The most fires (15.8%) took place on Saturday, and the least (12.6%) on Tuesday.
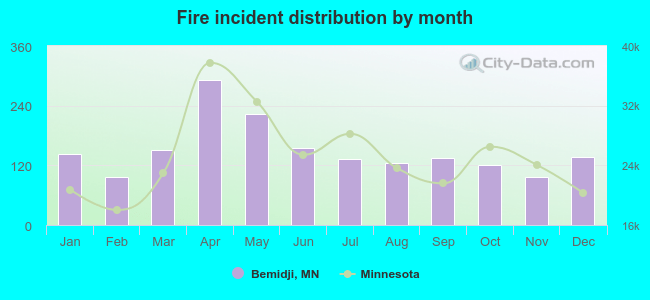 According to the 1,804 reports from years 2002 - 2018 most fires (16.2%) took place during April, and the least (5.4%) in February.
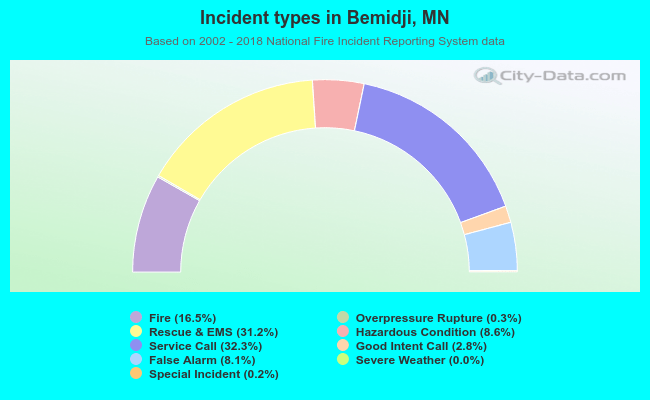 Out of all 10,947 cases reported during the years 2002 - 2018, the most belonged to the categories: Service Call (32.3%), Rescue & EMS (31.2%), and Fire (16.5%).
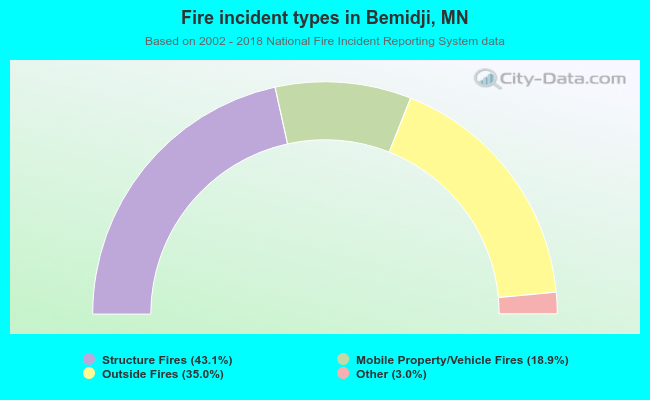 When looking into fire subcategories, the most reports belonged to: Structure Fires (43.1%), and Outside Fires (35.0%).