Berne: Fire Incidents, Indiana (IN)
Where are fire incidents reported in Berne, IN
Something went wrong! Please refresh the page.
|
| |||||||||||||||||||||||||||||||||||||||||||||||||||||||||||||||||||||||||||||||||||||||||||||||||||||||||||||
2002 - 2017 National Fire Incident Reporting System (NFIRS) incidents
- Incident types reported to NFIRS in Berne, IN
- 36250.4%Fire
- 9813.6%Rescue & EMS
- 8912.4%Hazardous Condition
- 699.6%Service Call
- 456.3%False Alarm
- 375.2%Good Intent Call
- 81.1%Special Incident
- 60.8%Overpressure Rupture
- 40.6%Severe Weather
- Fire incident types reported to NFIRS in Berne, IN
- 16345.0%Structure Fires
- 12634.8%Outside Fires
- 5515.2%Mobile Property/Vehicle Fires
- 185.0%Other
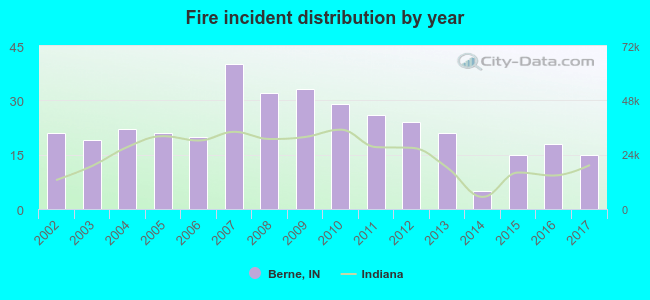 Based on the data from the years 2002 - 2017 the average number of fires per year is 23. The highest number of reported fires - 40 took place in 2007, and the least - 5 in 2014. The data has a declining trend.
 26.5% incidents where reported in the morning and 73.5% in the evening. The most fires (18.8%) took place on Saturday, and the least (10.5%) on Sunday.
 According to the 362 fire incident reports from years 2002 - 2017 most fires (11.0%) took place during April, and the least (5.8%) in December.
 Out of all 718 cases reported during the years 2002 - 2017, the most belonged to the categories: Fire (50.4%), Rescue & EMS (13.6%), and Hazardous Condition (12.4%).
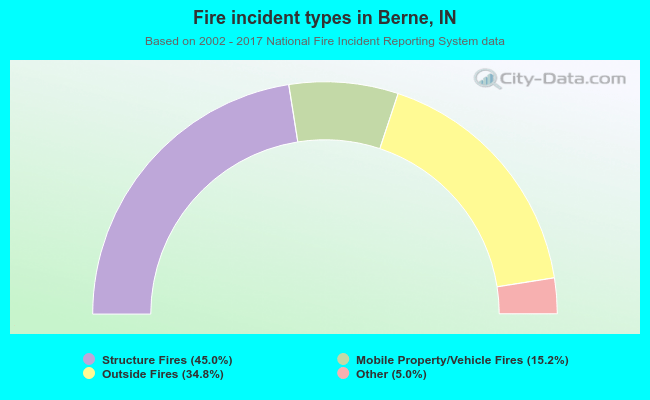 When looking into fire subcategories, the most incidents belonged to: Structure Fires (45.0%), and Outside Fires (34.8%).