| Fire incidents reported |
|---|
| Sreet name | Count |
|---|
| 1019 HWY 167 S | 6 | | 10567 HWY 2 | 4 | | 1085 HOLLY STREET | 4 | | 11980 HWY 2 | 4 | | 13249 HWY 2 | 4 | | 15432 HWY 2 | 4 | | 160 W 6TH STREET | 4 | | 2155 PATRICK CHURCH RD | 4 | | 304 GRAY STREET | 4 | | 508 CEDRIC STREET | 4 | | 604 4TH STREET | 4 | | HUNT PLANT RD | 4 | | HWY 550 @ HOLLAND RD. | 4 | | JINKS RD EVERGREEN RD | 4 | | SINGLETON RD | 4 | | 1007 HIGHWAY 167 | 2 | | 101 1ST STREET | 2 | | 101 LAKE TERRACE | 2 | | 1017 HWY 167 S. | 2 | | 104 ROGERS STREET | 2 | | 1040 HOG PEN RD | 2 | | 105 PENN RD | 2 | | 10571 HWY 2 | 2 | | 106 4TH STREET | 2 | | 106 ROGERS STREET | 2 |
| | | Fire incidents reported |
|---|
| Sreet name | Count |
|---|
| 1075 HOLLY ST. | 2 | | 108 MAPLE STREET | 2 | | 109 CHURCH STREET | 2 | | 109 HUBERTS DR PVT | 2 | | 1099 HWY 167 | 2 | | 1116 GRAVES STREET | 2 | | 113 WILLOW ST. | 2 | | 114 WILLIS REED STREET | 2 | | 115 W 4TH STREET | 2 | | 116 CHURCH STREET | 2 | | 120 TUCKER RD | 2 | | 121 3RD STREET | 2 | | 121 HUBBARD STREET | 2 | | 1218 WELDON CHURCH RD | 2 | | 123 COLE STREET | 2 | | 124 ELM STREET | 2 | | 125 6TH STREET | 2 | | 125 WOODLAMDS TRAIL DRIVE | 2 | | 125 WOODLAND TRAILS DRIVE | 2 | | 126 BARRET RD | 2 | | 126 CHURCH STREET | 2 | | 128 JIMMY BOWEN RD | 2 | | 12841 HWY 2 | 2 | | 137 CHURCH STREET | 2 | | |
|
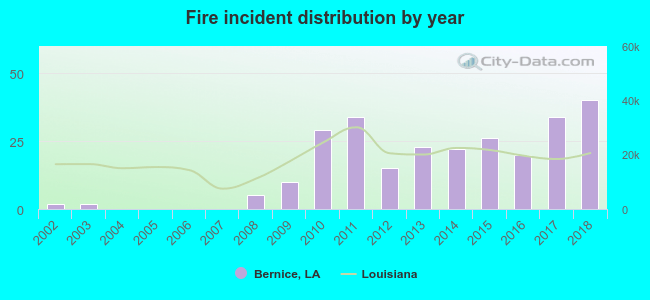 According to the data from the years 2002 - 2018 the average number of fires per year is 15. The highest number of reported fires - 40 took place in 2018, and the least - 0 in 2004. The data has a growing trend.
 25.6% incidents where reported in the morning and 74.4% in the evening. The most fires (18.7%) took place on Friday, and the least (12.2%) on Wednesday.
 According to the 262 incident reports from years 2002 - 2018 most fires (13.0%) took place during July, and the least (2.7%) in April.
 Out of all 836 cases reported during the years 2002 - 2018, the most belonged to the categories: Rescue & EMS (39.0%), Fire (31.3%), and Service Call (15.9%).
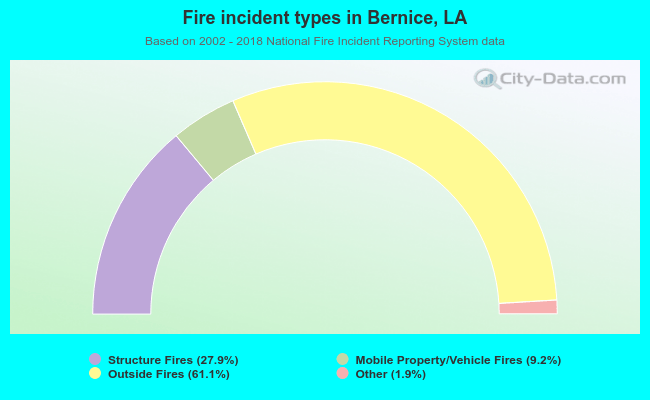 When looking into fire subcategories, the most reports belonged to: Outside Fires (61.1%), and Structure Fires (27.9%).