Beulah: Fire Incidents, North Dakota (ND)
Where are fire incidents reported in Beulah, ND
Something went wrong! Please refresh the page.
|
| |||||||||||||||||||||||||||||||||||||||||||||||||||||||||||||||||||||||||||||||||||||||||||||||||||||||||||||
2002 - 2018 National Fire Incident Reporting System (NFIRS) incidents
- Incident types reported to NFIRS in Beulah, ND
- 21560.6%Fire
- 6016.9%Rescue & EMS
- 329.0%Good Intent Call
- 267.3%Hazardous Condition
- 123.4%False Alarm
- 72.0%Service Call
- 20.6%Overpressure Rupture
- 10.3%Special Incident
- Fire incident types reported to NFIRS in Beulah, ND
- 10347.9%Outside Fires
- 7334.0%Structure Fires
- 3616.7%Mobile Property/Vehicle Fires
- 31.4%Other
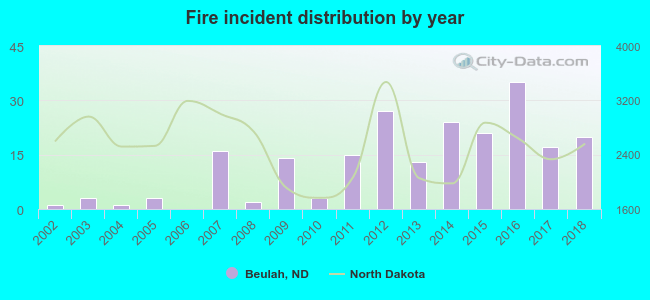 According to the data from the years 2002 - 2018 the average number of fires per year is 13. The highest number of fire incidents - 35 took place in 2016, and the least - 0 in 2006. The data has a rising trend.
 28.8% incidents where reported in the morning and 71.2% in the evening. The most fires (18.6%) took place on Monday, and the least (11.6%) on Wednesday.
 Based on the 215 incident reports from years 2002 - 2018 most fires (20.9%) took place during July, and the least (3.7%) in January.
 Out of all 355 cases reported during the years 2002 - 2018, the most belonged to the categories: Fire (60.6%), Rescue & EMS (16.9%), and Good Intent Call (9.0%).
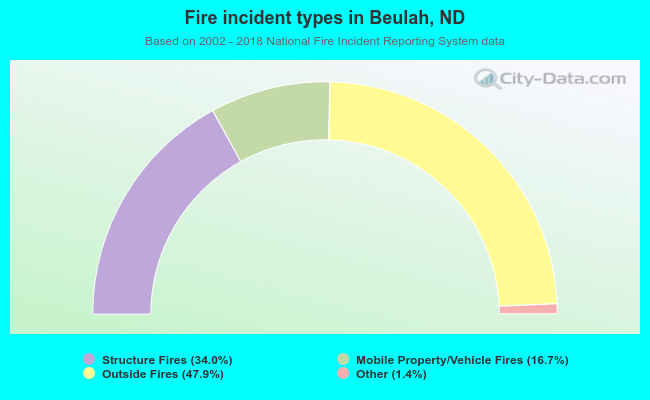 When looking into fire subcategories, the most incidents belonged to: Outside Fires (47.9%), and Structure Fires (34.0%).