| Fire incidents reported |
|---|
| Sreet name | Count |
|---|
| CHAMBERSBURG RD | 34 | | CHAMBERSBURG ROAD | 22 | | SHIPPENSBURG RD | 22 | | ARENDTSVILLE RD | 18 | | YORK ST | 16 | | BIGLERVILLE ROAD | 14 | | BIGLERVILLE RD | 12 | | MAIN ST | 12 | | NAWAKWA RD | 12 | | SOUTH MAIN STREET | 12 | | FLOHRS CHURCH RD | 10 | | TABLE ROCK RD | 10 | | GOLDENVILLE RD | 8 | | HILLTOWN ROAD | 8 | | NAWAKWA ROAD | 8 | | NEW RD | 8 | | POTATO RD | 8 | | BEECHERSTOWN RD | 6 | | CLEAR SPRINGS RD | 6 | | NAWAWKWA RD | 6 | | ROCKY RD | 6 | | TABLE ROCK ROAD | 6 | | UPPER TEMPLE ROAD | 6 | | WENKSVILLE RD | 6 | | CARLISLE RD | 4 |
| | | Fire incidents reported |
|---|
| Sreet name | Count |
|---|
| CARLISLE ROAD | 4 | | CENTER MILLS ROAD | 4 | | DUG HILL RD | 4 | | EAST YORK STREET | 4 | | EXCELSIOR RD | 4 | | EXCELSIOR ROAD | 4 | | FAIRVIEW FRUIT RD | 4 | | FAIRVIEW FRUIT ROAD | 4 | | HEIDLERSBURG RD | 4 | | NARROWS RD | 4 | | NEW ROAD | 4 | | NORTH MAIN STREET | 4 | | OLD CARLISLE ROAD | 4 | | PENN ST | 4 | | SLATE ROCK RD | 4 | | UPPER TEMPLE RD | 4 | | ARENDTSVILLE ROAD | 2 | | BENDERSVILLEWENKSVILLE RD | 2 | | BOYD'S HOLLOW ROAD | 2 | | BOYD'S SCHOOLHOUSE ROAD | 2 | | BOYDS HOLLOW RD | 2 | | BOYDS SCHOOL HOUSE RD | 2 | | BOYER NURSERY ROAD | 2 | | BOYERS NURSERY RD | 2 | | |
|
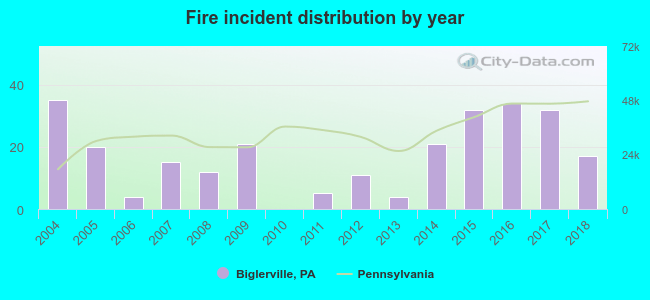 According to the data from the years 2004 - 2018 the average number of fires per year is 18. The highest number of reported fire incidents - 35 took place in 2004, and the least - 0 in 2010. The data has a declining trend.
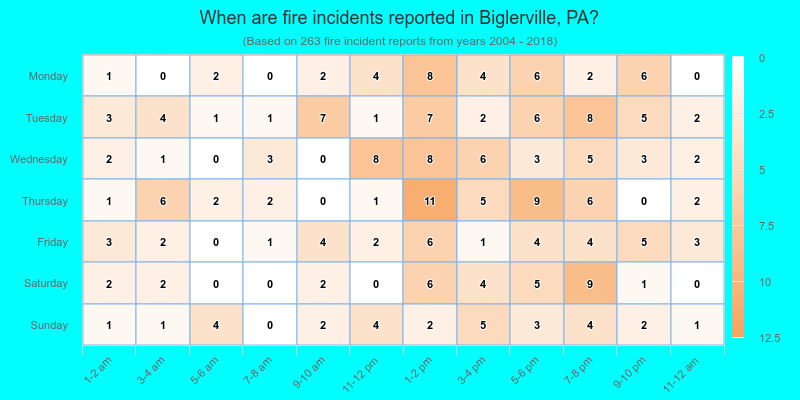
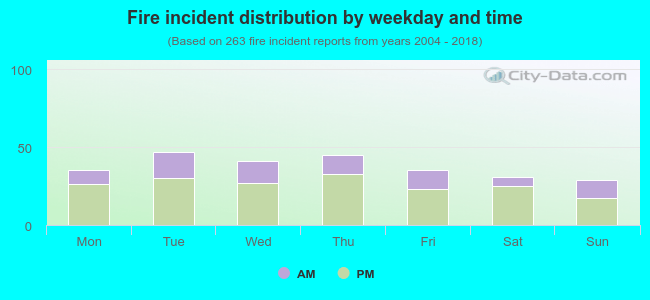 31.2% incidents where reported in the morning and 68.8% in the evening. The most fires (17.9%) took place on Tuesday, and the least (11.0%) on Sunday.
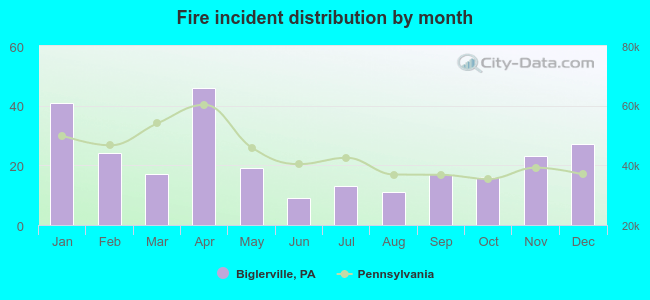 Based on the 263 fire incidents from years 2004 - 2018 most fires (17.5%) took place during April, and the least (3.4%) in June.
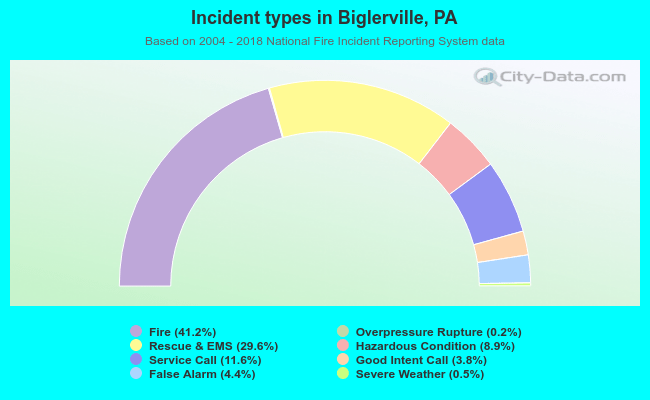 Out of all 639 cases reported during the years 2004 - 2018, the most belonged to the categories: Fire (41.2%), Rescue & EMS (29.6%), and Service Call (11.6%).
 When looking into fire subcategories, the most incidents belonged to: Structure Fires (59.3%), and Outside Fires (27.4%).