| Fire incidents reported |
|---|
| Sreet name | Count |
|---|
| STATE HIGHWAY ZZ | 14 | | 12111 HWY 14 | 10 | | HWY 60 | 8 | | 311 GREISMER RD | 6 | | HWY 14 | 6 | | POSSUM TROT RD | 6 | | STATE HIGHWAY 14 | 6 | | STATE HIGHWAY M | 6 | | WISE HILL RD | 6 | | 000 VERMULE RD | 4 | | 2407 SPRINGCREEK | 4 | | 2633 SILVER LAKES ROAD | 4 | | 419 TERRILL RD | 4 | | HONEYSUCKLE RD | 4 | | PIN OAK LN | 4 | | PINE | 4 | | ROSEHILL RD | 4 | | S PINE | 4 | | SILVER LAKE RD | 4 | | SOUTH PINE | 4 | | TERRILL RD | 4 | | US HIGHWAY 60 | 4 | | WISEHILL RD | 4 | | ZOLLER RD | 4 | | 000 BEAL RD | 2 |
| | | Fire incidents reported |
|---|
| Sreet name | Count |
|---|
| 107 TERRELL CREEK RD | 2 | | 111 SPRINGCREEK RD | 2 | | 1161 CLAY HILL RD | 2 | | 12005 HWY 174 | 2 | | 12111 W HWY 14 | 2 | | 123 PURDY | 2 | | 1245 LAWRENCE COUNTY FARM ROAD | 2 | | 1285 N METZELTEIN RD | 2 | | 14 HWY & DRIER RD | 2 | | 14227 HWY T | 2 | | 14625 W. PINE HILL LANE | 2 | | 15431 W HWY 14 | 2 | | 1561 BEAVER DAM ROAD | 2 | | 16017 HWY 14 | 2 | | 1623 POSSUM TROT ROAD | 2 | | 167 JACE RD | 2 | | 1671 N HWY 60 | 2 | | 1709 HONEYSUCKLE RD | 2 | | 17765 LAWRENCE 1247 | 2 | | 1846 US HWY 60 N | 2 | | 1953 KIMBERLIN MILL RD | 2 | | 204 SILVER LAKES ROAD | 2 | | 204 WODDS EDGE RD | 2 | | 211 LINDA LN | 2 | | |
|
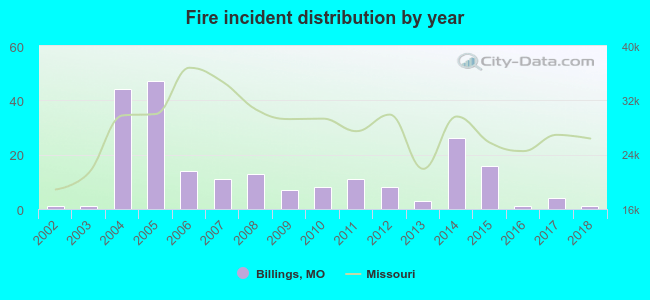 According to the data from the years 2002 - 2018 the average number of fires per year is 13. The highest number of reported fires - 47 took place in 2005, and the least - 1 in 2002. The data has a constant trend.
 25.0% incidents where reported in the morning and 75.0% in the evening. The most fires (17.6%) took place on Thursday, and the least (8.3%) on Monday.
 According to the 216 fires from years 2002 - 2018 most fires (19.0%) took place during February, and the least (3.2%) in November.
 Out of all 370 cases reported during the years 2002 - 2018, the most belonged to the categories: Fire (58.4%), Overpressure Rupture (25.7%), and Service Call (7.6%).
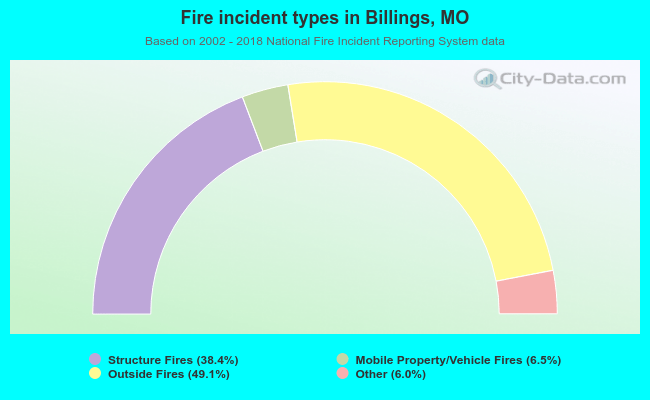 When looking into fire subcategories, the most incidents belonged to: Outside Fires (49.1%), and Structure Fires (38.4%).