Binger: Fire Incidents, Oklahoma (OK)
Where are fire incidents reported in Binger, OK
Something went wrong! Please refresh the page.
|
| |||||||||||||||||||||||||||||||||||||||||||||||||||||||||||||||||||||||||||||||||||||||||||||||||||||||||||||
| Other | 193 | |||||||||||||||||||||||||||||||||||||||||||||||||||||||||||||||||||||||||||||||||||||||||||||||||||||||||||||
2004 - 2018 National Fire Incident Reporting System (NFIRS) incidents
- Incident types reported to NFIRS in Binger, OK
- 37951.8%Fire
- 27137.0%Rescue & EMS
- 334.5%Good Intent Call
- 273.7%Service Call
- 152.0%Hazardous Condition
- 50.7%False Alarm
- 10.1%Overpressure Rupture
- 10.1%Severe Weather
- Fire incident types reported to NFIRS in Binger, OK
- 29577.8%Outside Fires
- 5213.7%Structure Fires
- 277.1%Mobile Property/Vehicle Fires
- 51.3%Other
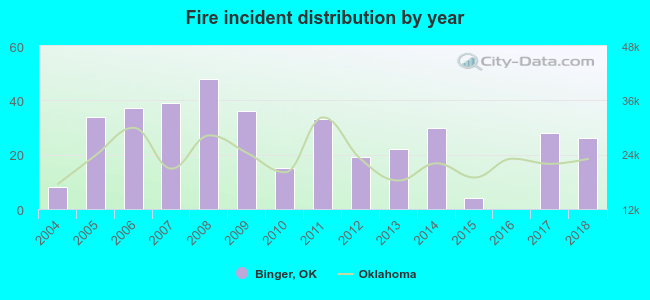 According to the data from the years 2004 - 2018 the average number of fires per year is 25. The highest number of reported fires - 48 took place in 2008, and the least - 0 in 2016. The data has a rising trend.
 17.4% incidents where reported in the morning and 82.6% in the evening. The most fires (16.9%) took place on Tuesday, and the least (11.6%) on Wednesday.
 According to the 379 fire incidents from years 2004 - 2018 most fires (14.8%) took place during March, and the least (3.4%) in October.
 Out of all 732 cases reported during the years 2004 - 2018, the most belonged to the categories: Fire (51.8%), Rescue & EMS (37.0%), and Good Intent Call (4.5%).
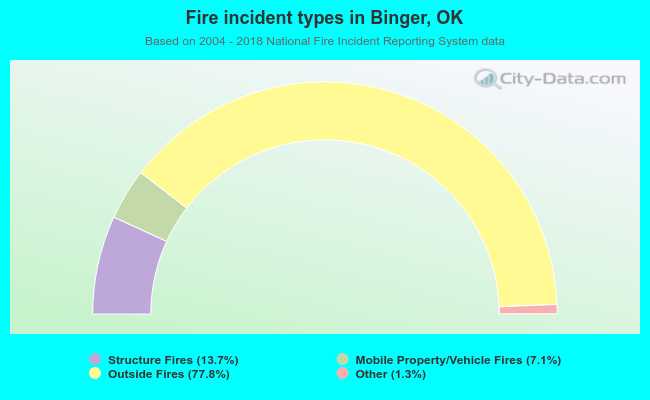 When looking into fire subcategories, the most reports belonged to: Outside Fires (77.8%), and Structure Fires (13.7%).