| Fire incidents reported |
|---|
| Sreet name | Count |
|---|
| DILLARD RD | 24 | | SR 64 | 10 | | SR 145 | 8 | | WICKLIFFE RD | 8 | | S.R. 64 HWY | 6 | | SCHNELLVILLE RD | 6 | | 1025E | 4 | | 3401 S KINGS RIDGE RD | 4 | | 3606 S KINGS RIDGE RD | 4 | | 5 ST RD 145 RD | 4 | | 625S | 4 | | DEWITT SCHOOL RD | 4 | | EAST OF BIRDSEYE | 4 | | KINGS RIDGE ROAD RD | 4 | | KYANA RD | 4 | | SR 164 | 4 | | STATE ROAD 64 | 4 | | STATE ROAD 64 HWY | 4 | | 1/2 MILE E ECKERTY Y 1/4 | 2 | | 1/2 MILE WEST HWY | 2 | | 10036 ST RD 64 RD | 2 | | 10194 E ST RD 64 | 2 | | 1025 E AND SCHNELLVILLE RD | 2 | | 1025 E CONSERVATION CLUB | 2 | | 1025 RD | 2 |
| | | Fire incidents reported |
|---|
| Sreet name | Count |
|---|
| 104 W 2ND ST | 2 | | 10675 ST RD 64 RD | 2 | | 107 E 1ST ST | 2 | | 10974 E 175 S | 2 | | 1175 COUNTY ROAD | 2 | | 11937 E BORDEN HILL RD RD | 2 | | 141 E 1ST | 2 | | 152 WEST 3RD STREET ST | 2 | | 1ST 5TH ST ST | 2 | | 20 POPULAR STREET | 2 | | 204 ST RD 145 | 2 | | 25 BERGS LANE RD | 2 | | 28990 CLOVERDALE ROAD | 2 | | 310 SR 145 | 2 | | 3102 KING RIDGE ROAD | 2 | | 3114 S 1025 RD | 2 | | 3572 S PINE RIDGE RD | 2 | | 400S | 2 | | 500 W ST RD64 | 2 | | 506 S SR 145 | 2 | | 531 ELM STREET ST | 2 | | 5681 S SR RD 145 | 2 | | 5767 S MENTOR ROAD RD | 2 | | 625 S | 2 | | |
|
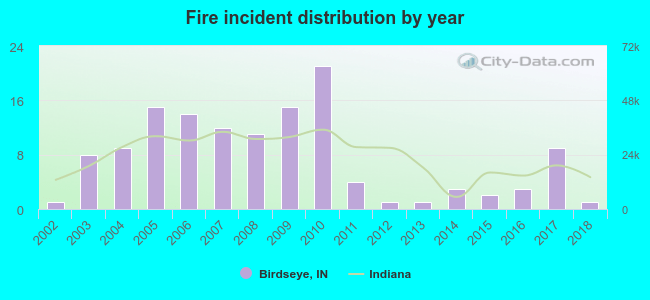 According to the data from the years 2002 - 2018 the average number of fires per year is 8. The highest number of reported fire incidents - 21 took place in 2010, and the least - 1 in 2002. The data has a constant trend.
 66.2% incidents where reported in the morning and 33.8% in the evening. The most fires (16.9%) took place on Monday, and the least (9.2%) on Sunday.
 Based on the 130 fire incident reports from years 2002 - 2018 most fires (16.9%) took place during October, and the least (3.1%) in May.
 Out of all 233 cases reported during the years 2002 - 2018, the most belonged to the categories: Fire (55.8%), Overpressure Rupture (31.3%), and Rescue & EMS (5.6%).
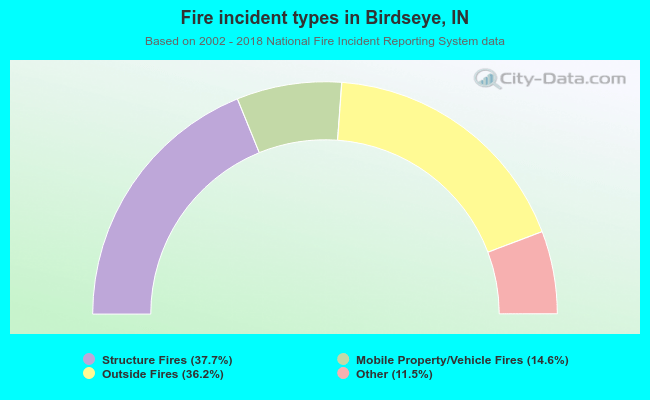 When looking into fire subcategories, the most reports belonged to: Structure Fires (37.7%), and Outside Fires (36.2%).