Black Eagle: Fire Incidents, Montana (MT)
Where are fire incidents reported in Black Eagle, MT
Something went wrong! Please refresh the page.
|
| |||||||||||||||||||||||||||||||||||||||||||||||||||||||||||||||||||||||||||||||||||||||||||||||||||||||||||||
2002 - 2018 National Fire Incident Reporting System (NFIRS) incidents
- Incident types reported to NFIRS in Black Eagle, MT
- 34540.1%Rescue & EMS
- 23727.6%Fire
- 13615.8%Hazardous Condition
- 677.8%Good Intent Call
- 384.4%Service Call
- 333.8%False Alarm
- 20.2%Severe Weather
- 10.1%Overpressure Rupture
- 10.1%Special Incident
- Fire incident types reported to NFIRS in Black Eagle, MT
- 15465.0%Outside Fires
- 5523.2%Structure Fires
- 218.9%Mobile Property/Vehicle Fires
- 73.0%Other
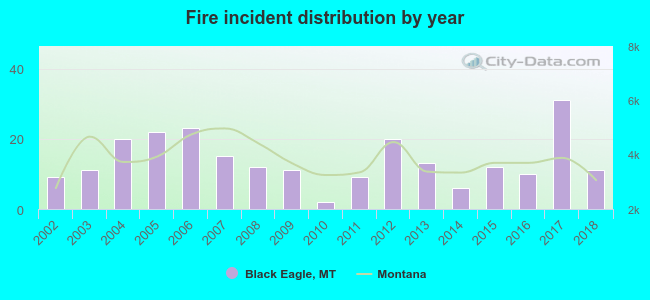 Based on the data from the years 2002 - 2018 the average number of fires per year is 14. The highest number of fire incidents - 31 took place in 2017, and the least - 2 in 2010. The data has a rising trend.
 Based on the reports from the years 2002 - 2018 the average number of fire-related casualties per year is 0. The highest number of injuries - 1 took place in 2004, and the lowest - 0 in 2002. The data has a constant trend.
 22.8% incidents where reported in the morning and 77.2% in the evening. The most fires (19.4%) took place on Tuesday, and the least (11.0%) on Monday.
 According to the 237 fire incidents from years 2002 - 2018 most fires (24.9%) took place during July, and the least (2.1%) in January.
 Out of all 860 cases reported during the years 2002 - 2018, the most belonged to the categories: Rescue & EMS (40.1%), Fire (27.6%), and Hazardous Condition (15.8%).
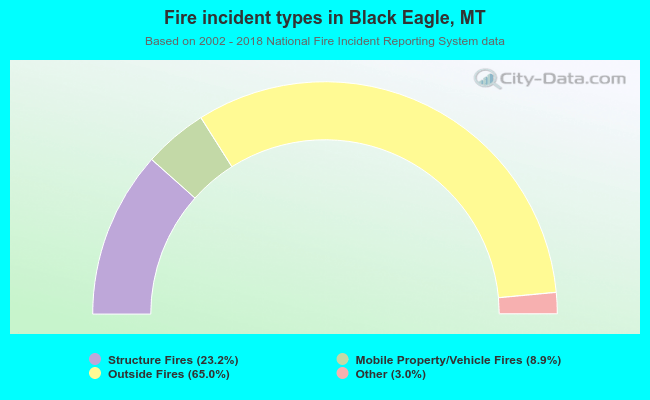 When looking into fire subcategories, the most incidents belonged to: Outside Fires (65.0%), and Structure Fires (23.2%).