Black Forest: Fire Incidents, Colorado (CO)
Where are fire incidents reported in Black Forest, CO
Something went wrong! Please refresh the page.
|
| |||||||||||||||||||||||||||||||||||||||||||||||||||||||||||||||||||||||||||||||||||||||||||||||||||||||||||||
2003 - 2018 National Fire Incident Reporting System (NFIRS) incidents
- Incident types reported to NFIRS in Black Forest, CO
- 91837.5%Rescue & EMS
- 43017.6%Good Intent Call
- 40416.5%Fire
- 29812.2%Hazardous Condition
- 2068.4%Service Call
- 1666.8%False Alarm
- 130.5%Overpressure Rupture
- 80.3%Severe Weather
- 70.3%Special Incident
- Fire incident types reported to NFIRS in Black Forest, CO
- 21453.0%Outside Fires
- 15638.6%Structure Fires
- 225.4%Other
- 123.0%Mobile Property/Vehicle Fires
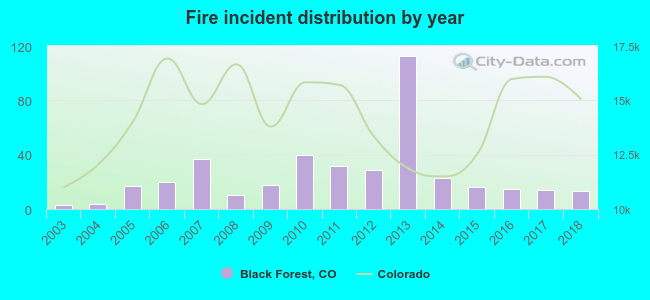 According to the data from the years 2003 - 2018 the average number of fires per year is 25. The highest number of fires - 113 took place in 2013, and the least - 3 in 2003. The data has a rising trend.
The average number of yearly fire incidents per 10k residents in Black Forest, CO compared to nearest cities:
(Note: Based on data for the last 3 years, including only cities with population 5,000 and above)
| Black Forest: | 10.7 |
| Gleneagle: | 4.0 |
| Woodmoor: | 2.3 |
| Air Force Academy: | 1.5 |
| Monument: | 78.8 |
| Elsmere: | 0.3 |
| Cimarron Hills: | 8.7 |
| Colorado Springs: | 17.3 |
| Manitou Springs: | 23.8 |
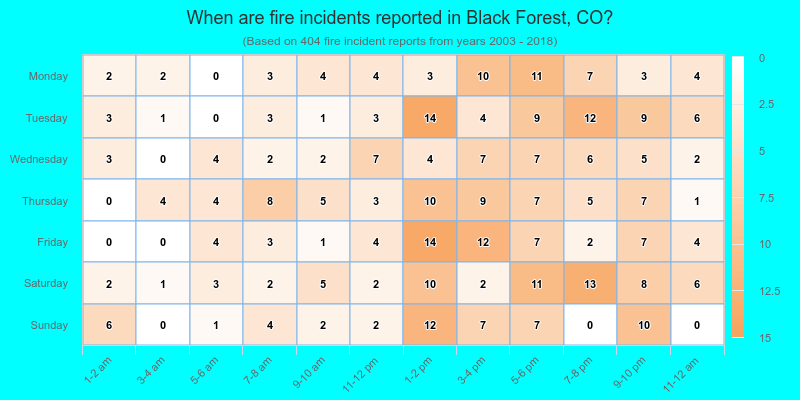
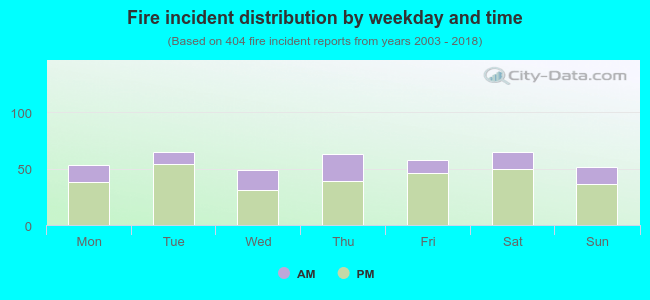 27.2% incidents where reported in the morning and 72.8% in the evening. The most fires (16.1%) took place on Tuesday, and the least (12.1%) on Wednesday.
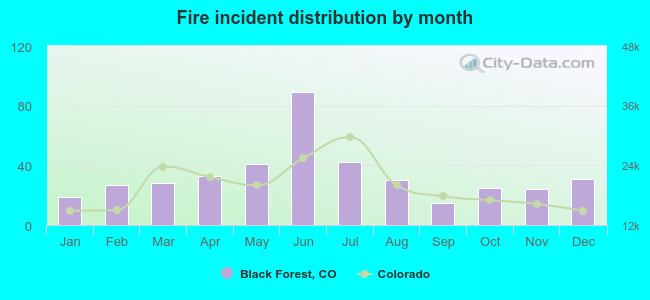 According to the 404 reports from years 2003 - 2018 most fires (22.0%) took place during June, and the least (3.7%) in September.
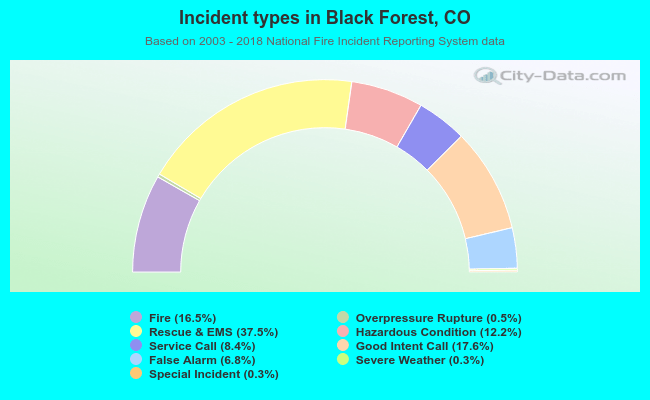 Out of all 2,450 cases reported during the years 2003 - 2018, the most belonged to the categories: Rescue & EMS (37.5%), Good Intent Call (17.6%), and Fire (16.5%).
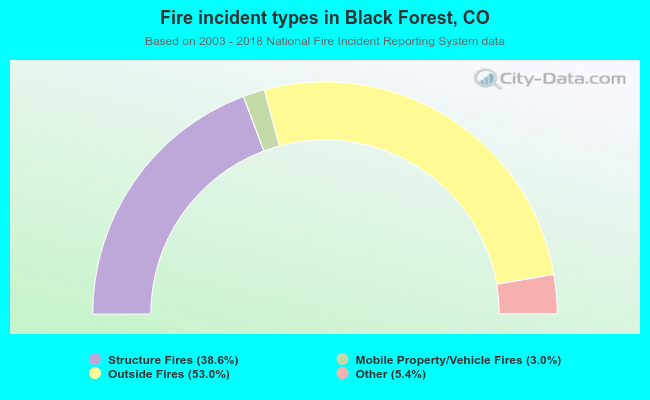 When looking into fire subcategories, the most incidents belonged to: Outside Fires (53.0%), and Structure Fires (38.6%).