Blairstown: Fire Incidents, New Jersey (NJ)
Where are fire incidents reported in Blairstown, NJ
Something went wrong! Please refresh the page.
|
| |||||||||||||||||||||||||||||||||||||||||||||||||||||||||||||||||||||||||||||||||||||||||||||||||||||||||||||
2002 - 2018 National Fire Incident Reporting System (NFIRS) incidents
- Incident types reported to NFIRS in Blairstown, NJ
- 42129.5%Hazardous Condition
- 35624.9%Fire
- 28820.2%False Alarm
- 19113.4%Rescue & EMS
- 956.7%Good Intent Call
- 624.3%Service Call
- 110.8%Special Incident
- 40.3%Overpressure Rupture
- Fire incident types reported to NFIRS in Blairstown, NJ
- 20657.9%Structure Fires
- 9426.4%Outside Fires
- 4111.5%Mobile Property/Vehicle Fires
- 154.2%Other
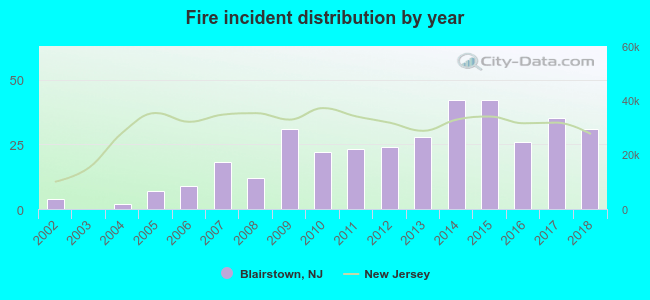 According to the data from the years 2002 - 2018 the average number of fires per year is 21. The highest number of reported fire incidents - 42 took place in 2014, and the least - 0 in 2003. The data has a growing trend.
 27.8% incidents where reported in the morning and 72.2% in the evening. The most fires (16.9%) took place on Sunday, and the least (12.4%) on Thursday.
 According to the 356 incident reports from years 2002 - 2018 most fires (15.4%) took place during April, and the least (3.4%) in September.
 Out of all 1,428 cases reported during the years 2002 - 2018, the most belonged to the categories: Hazardous Condition (29.5%), Fire (24.9%), and False Alarm (20.2%).
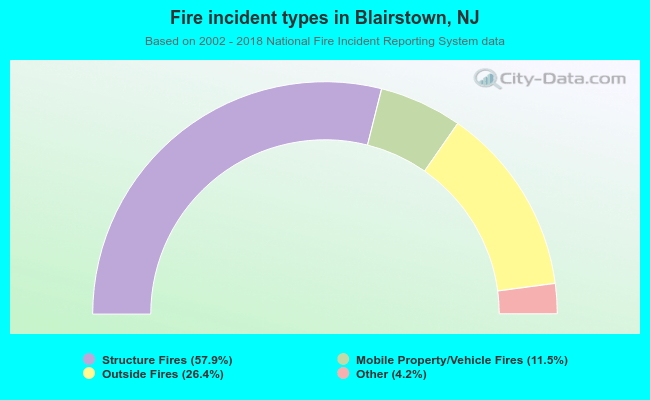 When looking into fire subcategories, the most reports belonged to: Structure Fires (57.9%), and Outside Fires (26.4%).