| Fire incidents reported |
|---|
| Sreet name | Count |
|---|
| MAIN ST | 36 | | BIRCH AV | 26 | | TOM RIDGE | 18 | | PHELPS AV | 12 | | SANDTRAP CIR | 12 | | BEECHWOOD HILLS DR | 10 | | DIXIE-BLANCHARD RD | 10 | | WASSON RD | 10 | | DIXIEBLANCHARD RD | 8 | | EVELYN DR | 8 | | JULIETTE ST | 8 | | SAND HILL AV | 8 | | ALEXANDER AV | 6 | | CHIPSHOT LN | 6 | | FRONT ST | 6 | | GARFIELD | 6 | | MARY ANNE CIR | 6 | | SHREVEPORT BLANCHARD HWY | 6 | | BROOKINGTON DR | 4 | | CAMDEN CIR | 4 | | CHICKAMAUGA TR | 4 | | ELLA CT | 4 | | FRONT ST | 4 | | GARFIELD AV | 4 | | KIPLING PL | 4 |
| | | Fire incidents reported |
|---|
| Sreet name | Count |
|---|
| MAPLE AV | 4 | | NORTHWOOD HILLS DR | 4 | | OLD MOORINGSPORT RD | 4 | | PAR CIR | 4 | | W ALEXANDER AV | 4 | | WARRINER AV | 4 | | ALEXANDER AVE | 2 | | ATTAWAY ST | 2 | | ATTAWAY ST | 2 | | BIRCH | 2 | | BLANCHARDFURRH RD | 2 | | BOUTTE CIR | 2 | | CHERRY HILL AV | 2 | | CLEVELAND ST | 2 | | COUNTRYAIRE DR | 2 | | DRIVERS WAY | 2 | | ELMWOOD HILLS DR | 2 | | FAIRWAY | 2 | | FAIRWAY VIEW | 2 | | FAIRWAY WAY | 2 | | FORREST AV | 2 | | GREEN MEADOW RD | 2 | | HWY 3049 | 2 | | JO LACEY DR | 2 | | KAY AV | 2 |
|
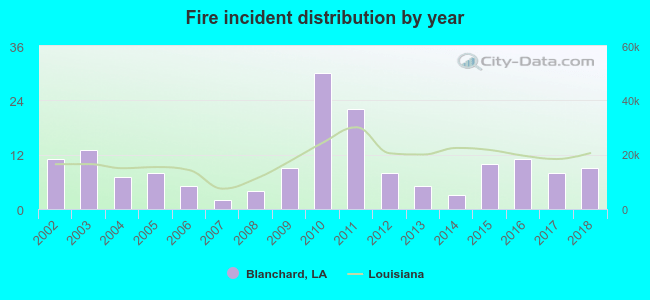 According to the data from the years 2002 - 2018 the average number of fires per year is 10. The highest number of reported fires - 30 took place in 2010, and the least - 2 in 2007. The data has a dropping trend.
 26.1% incidents where reported in the morning and 73.9% in the evening. The most fires (21.8%) took place on Saturday, and the least (9.1%) on Sunday.
 According to the 165 incident reports from years 2002 - 2018 most fires (11.5%) took place during January, and the least (3.6%) in August.
 Out of all 1,803 cases reported during the years 2002 - 2018, the most belonged to the categories: Overpressure Rupture (62.0%), Hazardous Condition (14.7%), and Fire (9.2%).
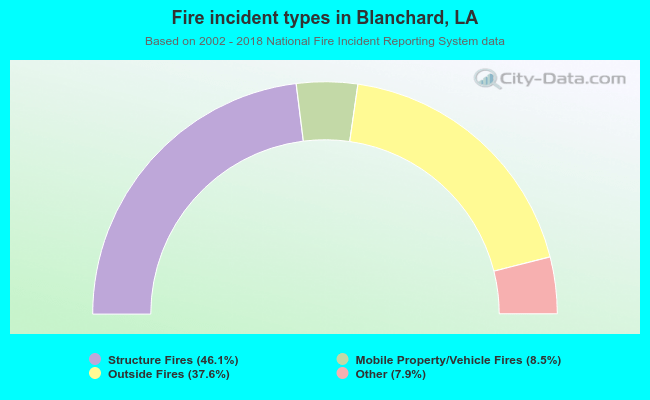 When looking into fire subcategories, the most reports belonged to: Structure Fires (46.1%), and Outside Fires (37.6%).