| Fire incidents reported |
|---|
| Sreet name | Count |
|---|
| HWY 191 | 14 | | BLUE MT ROAD | 6 | | HWY 95 | 6 | | S. HWY 191 | 6 | | BLANDING | 4 | | DEVILS CANYON HWY 191 | 4 | | HWY 191TRANSFER STATION | 4 | | N. REBEL ROAD | 4 | | SOUTH HWY 191 | 4 | | WEST WATER RD | 4 | | 10 S 200 W | 2 | | 100 EAST STREET | 2 | | 100 WEST 1200 SOUTH | 2 | | 1090 N HWY 191 | 2 | | 1200 NORTH BLUE MTN. ROAD | 2 | | 1200 S 100 E | 2 | | 1200 S. HYW 191 | 2 | | 1200 SOUTH 200 WEST | 2 | | 1210 N MOUNTAIN ROAD | 2 | | 1243 NORTH ASPEN LANE | 2 | | 1277 N 750 W | 2 | | 1292 N. GRAYSON PKWY | 2 | | 1292 NORTH GRAYSON PARKWAY | 2 | | 138 EAST 300 SOUTH | 2 | | 150 EAST 300 SOUTH | 2 |
| | | Fire incidents reported |
|---|
| Sreet name | Count |
|---|
| 161 S 200 W | 2 | | 161 SOUTH 200 WEST | 2 | | 1700 N RESEVOIR ROAD | 2 | | 1700 N RESIVOR ROAD | 2 | | 190 N 218 W | 2 | | 200 E 50 N | 2 | | 200 EAST 850 SOUTH | 2 | | 200 EAST, 600 SOUTH | 2 | | 200 N. 600 W. | 2 | | 2100 NORTH MTN ROAD | 2 | | 241 W 500 S | 2 | | 250 WEST 700 NORTH | 2 | | 252 N. 400 W. | 2 | | 262 N HWY 191 | 2 | | 273 WEST WATER ROAD DR | 2 | | 3 MILES SOUTH OF OLD CITY DUMP | 2 | | 300 N 100 W | 2 | | 300 W | 2 | | 300 W. 1200 S. | 2 | | 300S 100E | 2 | | 301 N BRONCO BLVD | 2 | | 310 S. 30 W. | 2 | | 350 N. 100 E. | 2 | | 377 E 400 S | 2 | | |
|
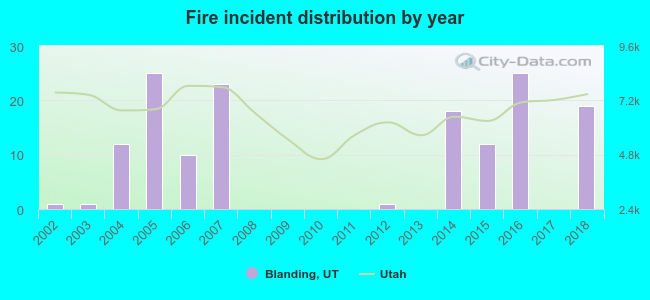 According to the data from the years 2002 - 2018 the average number of fires per year is 9. The highest number of reported fire incidents - 25 took place in 2005, and the least - 0 in 2008. The data has an increasing trend.
 According to the reports from the years 2002 - 2018 the average number of fire-related yearly deaths is 0. The highest number of deaths - 2 took place in 2004, and the lowest - 0 in 2002. The data has an increasing trend.
 24.5% incidents where reported in the morning and 75.5% in the evening. The most fires (19.7%) took place on Saturday, and the least (10.2%) on Tuesday.
 Based on the 147 fires from years 2002 - 2018 most fires (27.9%) took place during July, and the least (2.0%) in April.
 Out of all 260 cases reported during the years 2002 - 2018, the most belonged to the categories: Fire (56.5%), Overpressure Rupture (24.2%), and Rescue & EMS (8.5%).
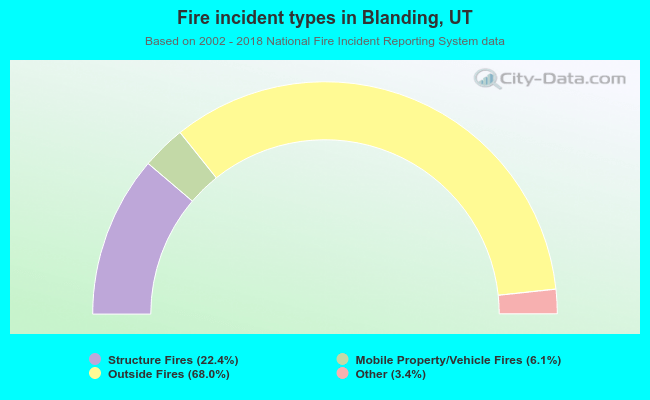 When looking into fire subcategories, the most incidents belonged to: Outside Fires (68.0%), and Structure Fires (22.4%).