| Fire incidents reported |
|---|
| Sreet name | Count |
|---|
| I84 | 90 | | I84 FWY | 66 | | HWY 26 | 32 | | HWY 30 | 30 | | CLOVER CREEK RD | 24 | | I 84 | 20 | | RIVER RD | 14 | | RIVER ROAD | 12 | | SPRING COVE RD | 12 | | BELL RAPIDS | 10 | | US HWY 30 | 10 | | CLOVER CREEK ROAD | 8 | | HILL CITY RD | 8 | | HWY 26 HWY | 8 | | INTERSTATE 84 | 8 | | OLD BLISS GRADE | 8 | | US HWY 26 HWY | 8 | | US HWY 30 HWY | 8 | | BLISS GRADE | 6 | | BLISS GRADE RD | 6 | | CLOVER CREEK RD & IDAHO ST | 6 | | HWY 30 HWY | 6 | | PROCTOR | 6 | | PROCTOR STREET | 6 | | SPRING COVE ROAD | 6 |
| | | Fire incidents reported |
|---|
| Sreet name | Count |
|---|
| 1200 | 4 | | 1502 SOUTH - 300 EAST | 4 | | 1ST AND PROCTOR | 4 | | 2350 SOUTH | 4 | | 300 E | 4 | | 383 EAST 1750 SOUTH | 4 | | 400 EAST - 5700 NORTH | 4 | | 4TH STREET | 4 | | AVE A RD | 4 | | HIGHWAY 26 | 4 | | POWER PLANT ROAD | 4 | | PROCTOR RD | 4 | | PROCTOR ST | 4 | | SHOESTRING RD | 4 | | US HWY 26 | 4 | | 1000 EAST - 2100 SOUTH | 2 | | 101 PROCTOR STREET | 2 | | 1050 S | 2 | | 1077 E 2100 S | 2 | | 1100 | 2 | | 1100 E | 2 | | 1100 E 2100 S | 2 | | 1100 EAST - 2100 SOUTH | 2 | | 1150 CLOVER CREEK RD | 2 | | |
|
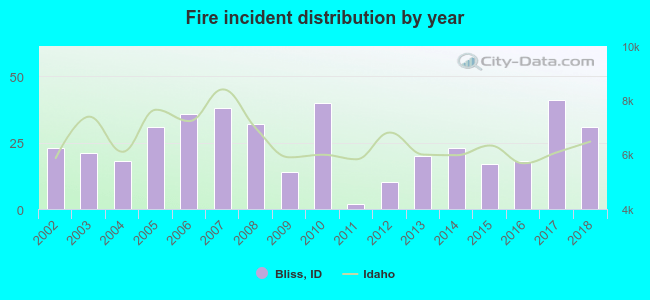 Based on the data from the years 2002 - 2018 the average number of fires per year is 24. The highest number of reported fire incidents - 41 took place in 2017, and the least - 2 in 2011. The data has a rising trend.
 23.1% incidents where reported in the morning and 76.9% in the evening. The most fires (16.1%) took place on Thursday, and the least (12.8%) on Friday.
 Based on the 415 reports from years 2002 - 2018 most fires (26.3%) took place during July, and the least (0.5%) in January.
 Out of all 770 cases reported during the years 2002 - 2018, the most belonged to the categories: Fire (53.9%), Rescue & EMS (17.9%), and Good Intent Call (16.4%).
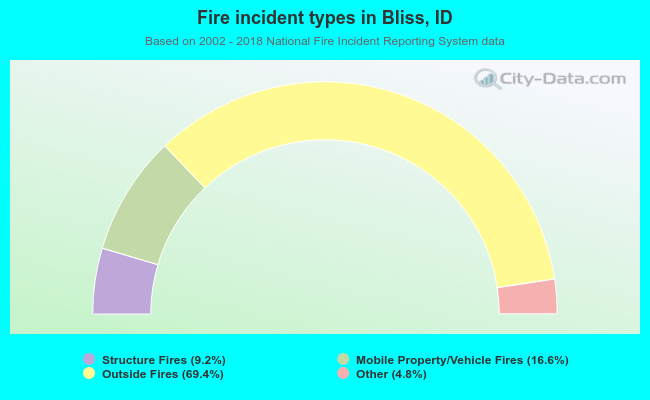 When looking into fire subcategories, the most incidents belonged to: Outside Fires (69.4%), and Mobile Property/Vehicle Fires (16.6%).