Bloomfield: Fire Incidents, Connecticut (CT)
Where are fire incidents reported in Bloomfield, CT
Something went wrong! Please refresh the page.
| Fire incidents reported | |
|---|---|
| Sreet name | Count |
| BLUE HILLS AVE | 316 |
| COTTAGE GROVE RD | 152 |
| SEABURY DR | 136 |
| PARK AVE | 118 |
| TUNXIS AVE | 68 |
| EAST DUDLEY TOWN RD | 62 |
| DANIEL BLVD | 52 |
| ROCKWELL AVE | 44 |
| WINTONBURY AVE | 42 |
| GRANBY ST | 40 |
| TUNXIS AVE | 38 |
| COTTAGE GROVE RD | 36 |
| GREENWOOD AVE | 34 |
| OLD WINDSOR RD | 34 |
| BEATRICE AVE | 30 |
| JEROME AVE | 30 |
| WOODLAND AVE | 30 |
| PARK AVE | 28 |
| WEDGEWOOD DR | 28 |
| BLOOMFIELD AVE | 26 |
| ELLSWORTH DR | 26 |
| FARMSTEAD CIR | 26 |
| COVENTRY ST | 24 |
| DOROTHY DR | 24 |
| EAST WINTONBURY AVE | 24 |
| GILBERT AVE | 24 |
| BLUE HILLS AVE | 22 |
| SUTTON PL | 22 |
| BROOKLINE AVE | 20 |
| DARBY ST | 20 |
| Other | 134 |
2003 - 2018 National Fire Incident Reporting System (NFIRS) incidents
- Incident types reported to NFIRS in Bloomfield, CT
- 2,83937.1%Hazardous Condition
- 1,71022.4%Fire
- 1,30917.1%False Alarm
- 90111.8%Service Call
- 4706.1%Good Intent Call
- 3845.0%Rescue & EMS
- 260.3%Overpressure Rupture
- Fire incident types reported to NFIRS in Bloomfield, CT
- 1,16768.2%Structure Fires
- 31918.7%Outside Fires
- 17210.1%Mobile Property/Vehicle Fires
- 523.0%Other
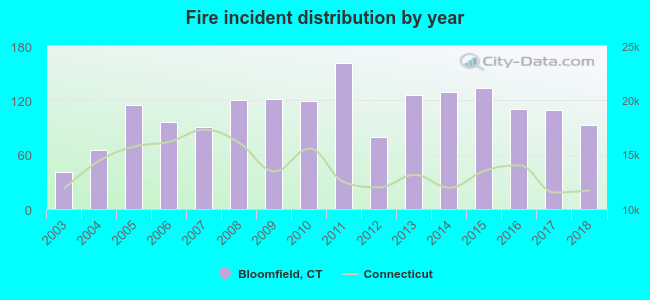 Based on the data from the years 2003 - 2018 the average number of fire incidents per year is 107. The highest number of reported fire incidents - 161 took place in 2011, and the least - 41 in 2003. The data has an increasing trend.
The average number of yearly fire incidents per 10k residents in Bloomfield, CT compared to nearest cities:
(Note: Based on data for the last 3 years, including only cities with population 5,000 and above)
| Bloomfield: | 50.8 |
| Windsor: | 48.0 |
| West Hartford: | 28.3 |
| Hartford: | 39.1 |
| Simsbury: | 16.0 |
| East Granby: | 93.2 |
| East Hartford: | 37.3 |
| Windsor Locks: | 41.3 |
| Avon: | 25.6 |
 The median response time based on all reported fire incidents is 6 minutes. This is similar to the Connecticut median value.
The median response time in Bloomfield, CT compared to nearest cities:
(Note: Based on data for all years, including only cities with at least 500 fire incidents)
| Bloomfield: | 6 minutes |
| Windsor: | 6 minutes |
| West Hartford: | 4 minutes |
| Hartford: | 4 minutes |
| Simsbury: | 5 minutes |
| East Granby: | 7 minutes |
| East Hartford: | 4 minutes |
| Windsor Locks: | 6 minutes |
| Avon: | 7 minutes |
 Based on the data from the years 2003 - 2018 the average number of fire-related casualties per year is 3. The highest number of injuries - 7 took place in 2005, and the lowest - 0 in 2004. The data has a growing trend.
The average number of casualties per 1,000 fires is 26. This indicator was the highest - 61 in 2005, and the lowest 0 in 2004. The trend for casualties per 1,000 fires is decreasing. Compared to the Connecticut value the number of casualties per 1,000 incidents is much higher.
Based on the data from the years 2003 - 2018 the average number of fire-related casualties per year is 3. The highest number of injuries - 7 took place in 2005, and the lowest - 0 in 2004. The data has a growing trend.
The average number of casualties per 1,000 fires is 26. This indicator was the highest - 61 in 2005, and the lowest 0 in 2004. The trend for casualties per 1,000 fires is decreasing. Compared to the Connecticut value the number of casualties per 1,000 incidents is much higher.Casualties per 1,000 incidents in Bloomfield, CT compared to nearest cities:
(Note: Based on data for all years, including only cities with at least 500 fire incidents)
| Bloomfield: | 26.3 |
| Windsor: | 1.1 |
| West Hartford: | 18.4 |
| Hartford: | 10.9 |
| Simsbury: | 6.9 |
| East Granby: | 9.0 |
| East Hartford: | 34.6 |
| Windsor Locks: | 13.6 |
| Avon: | 7.6 |
 36.1% incidents where reported in the morning and 63.9% in the evening. The most fires (15.2%) took place on Sunday, and the least (13.2%) on Wednesday.
 According to the 1,710 fire incidents from years 2003 - 2018 most fires (10.4%) took place during May, and the least (7.4%) in March.
 Out of all 7,647 cases reported during the years 2003 - 2018, the most belonged to the categories: Hazardous Condition (37.1%), Fire (22.4%), and False Alarm (17.1%).
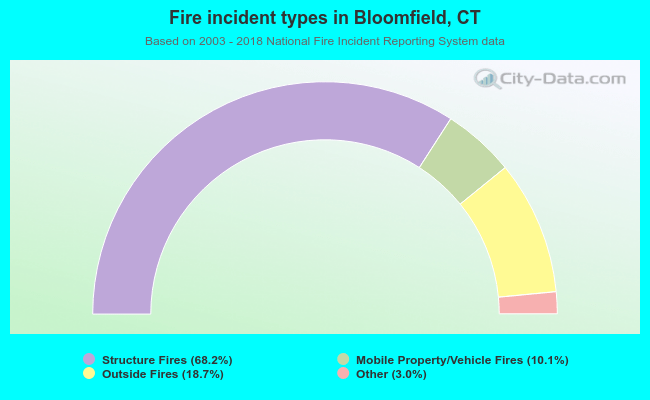 When looking into fire subcategories, the most incidents belonged to: Structure Fires (68.2%), and Outside Fires (18.7%).