| Fire incidents reported |
|---|
| Sreet name | Count |
|---|
| HWY 25 | 16 | | STATE HWY J | 10 | | HWY AB | 8 | | ST HWY E | 8 | | BLOOMFIELD | 6 | | BO GEARY CIRCLE | 6 | | HWY AC | 6 | | ST HWY M | 6 | | 18013 STATE HWY AC | 4 | | 19023 ST HWY M | 4 | | 21985 ST HWY Y | 4 | | AB HIGHWAY | 4 | | CO RD 524 | 4 | | COUNTY ROAD 221 | 4 | | COUNTY ROAD 413 | 4 | | HOLLY RIDGE CONSERVATION AREA | 4 | | HWY BB | 4 | | HWY M | 4 | | SALEM ST | 4 | | SALEM ST | 4 | | STATE HWY 25 | 4 | | STATE HWY E | 4 | | 1113 NORTH PRAIRIE ST | 2 | | 12651 STATE HWY J | 2 | | 13274 HWY J | 2 |
| | | Fire incidents reported |
|---|
| Sreet name | Count |
|---|
| 13484 EUBANKS DRIVE | 2 | | 13691 ST. HWY K | 2 | | 13949 COUNTY ROAD 284 | 2 | | 13949 CR 284 | 2 | | 14024 STATE HWY M | 2 | | 14038 STATE HWY M | 2 | | 14742 COUNTY ROAD 413 | 2 | | 14799 STATE HWY M | 2 | | 15250 COUNTY ROAD 420 | 2 | | 15399 COUNTY ROAD 527 | 2 | | 15597 ST HWY J | 2 | | 15673 STATE HWY M | 2 | | 16104 COUNTY ROAD 409 | 2 | | 16156 CR 420 | 2 | | 16324 COUNTY ROAD 511 | 2 | | 16450 CR 511 | 2 | | 16557 ST HWY F | 2 | | 16714 COUNTY ROAD 511 | 2 | | 16883 COUNTY ROAD 278 | 2 | | 16920 CR 537 | 2 | | 16992 COUNTY RD 527 | 2 | | 17005 COUNTY ROAD 278 | 2 | | 17033 CR 537 | 2 | | 17263 COUNTY ROAD 426 | 2 | | |
|
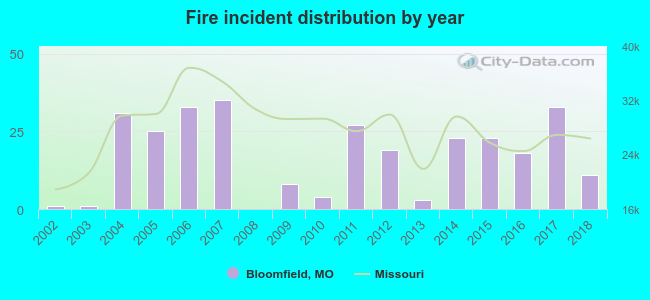 According to the data from the years 2002 - 2018 the average number of fires per year is 17. The highest number of reported fires - 35 took place in 2007, and the least - 0 in 2008. The data has a growing trend.
 28.1% incidents where reported in the morning and 71.9% in the evening. The most fires (22.0%) took place on Saturday, and the least (10.8%) on Wednesday.
 Based on the 295 fire incidents from years 2002 - 2018 most fires (12.9%) took place during January, and the least (4.1%) in December.
 Out of all 463 cases reported during the years 2002 - 2018, the most belonged to the categories: Fire (63.7%), Overpressure Rupture (19.2%), and Service Call (8.2%).
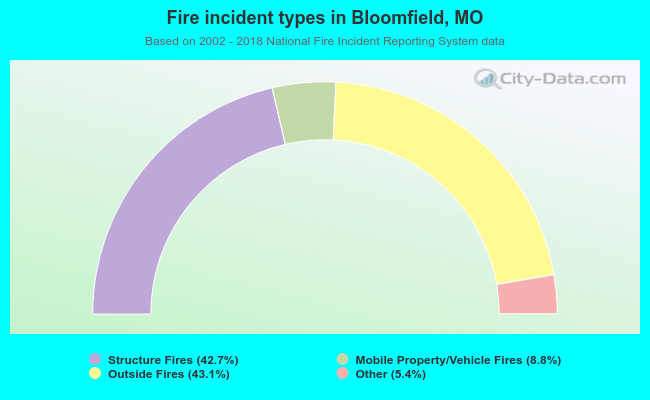 When looking into fire subcategories, the most incidents belonged to: Outside Fires (43.1%), and Structure Fires (42.7%).