Bloomfield: Fire Incidents, New Jersey (NJ)
Where are fire incidents reported in Bloomfield, NJ
Something went wrong! Please refresh the page.
| Fire incidents reported | |
|---|---|
| Sreet name | Count |
| BROAD ST | 314 |
| FRANKLIN ST | 174 |
| BLOOMFIELD AVE | 144 |
| HOOVER AVE | 140 |
| BROUGHTON AVE | 80 |
| LINDEN AVE | 72 |
| AUSTIN PL | 68 |
| BELLEVILLE AVE | 62 |
| LIBERTY ST | 62 |
| CONGER ST | 60 |
| BERKELEY AVE | 50 |
| MUNICIPAL PLZ | 48 |
| MONROE PL | 46 |
| GLENWOOD AVE | 44 |
| PASSAIC AVE | 42 |
| GARDEN STATE PKY | 36 |
| ORANGE ST | 36 |
| PARK AVE | 36 |
| DAVEY ST | 32 |
| GROVE ST | 32 |
| MONTGOMERY ST | 32 |
| SPRUCE ST | 32 |
| LLEWELLYN AVE | 30 |
| WASHINGTON ST | 28 |
| WALNUT ST | 26 |
| ARLINGTON AVE | 24 |
| WATSESSING AVE | 24 |
| DODD ST | 22 |
| PARK PL | 22 |
| NEWARK AVE | 20 |
| Other | 492 |
2003 - 2018 National Fire Incident Reporting System (NFIRS) incidents
- Incident types reported to NFIRS in Bloomfield, NJ
- 4,39129.2%Service Call
- 3,73324.8%Hazardous Condition
- 2,33015.5%Fire
- 2,02713.5%False Alarm
- 1,2328.2%Rescue & EMS
- 6264.2%Good Intent Call
- 5964.0%Special Incident
- 510.3%Overpressure Rupture
- 470.3%Severe Weather
- Fire incident types reported to NFIRS in Bloomfield, NJ
- 1,45962.6%Structure Fires
- 47020.2%Outside Fires
- 34214.7%Mobile Property/Vehicle Fires
- 592.5%Other
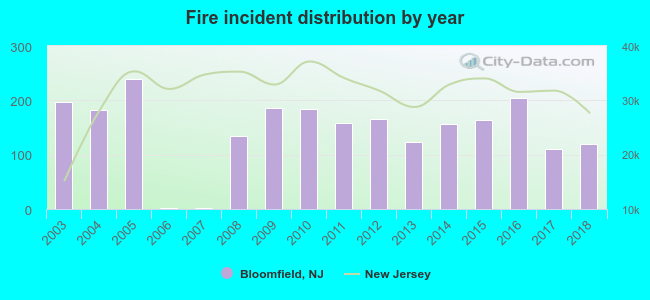 According to the data from the years 2003 - 2018 the average number of fire incidents per year is 146. The highest number of fires - 240 took place in 2005, and the least - 2 in 2006. The data has a dropping trend.
The average number of yearly fire incidents per 10k residents in Bloomfield, NJ compared to nearest cities:
(Note: Based on data for the last 3 years, including only cities with population 5,000 and above)
| Bloomfield: | 31.3 |
| Glen Ridge: | 15.6 |
| Belleville: | 25.0 |
| Montclair: | 14.4 |
| Nutley: | 44.0 |
| East Orange: | 48.4 |
| North Arlington: | 24.8 |
| Upper Montclair: | 11.2 |
| Orange: | 24.7 |
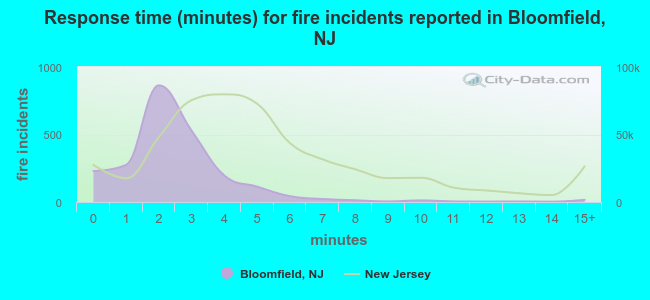 The median response time based on all reported fire incidents is 2 minutes. This is much lower compared to the state median value.
The median response time in Bloomfield, NJ compared to nearest cities:
(Note: Based on data for all years, including only cities with at least 500 fire incidents)
| Bloomfield: | 2 minutes |
| Belleville: | 3 minutes |
| Montclair: | 3 minutes |
| Nutley: | 2 minutes |
| East Orange: | 4 minutes |
| Orange: | 3 minutes |
| Lyndhurst: | 3 minutes |
| West Orange: | 5 minutes |
| Kearny: | 4 minutes |
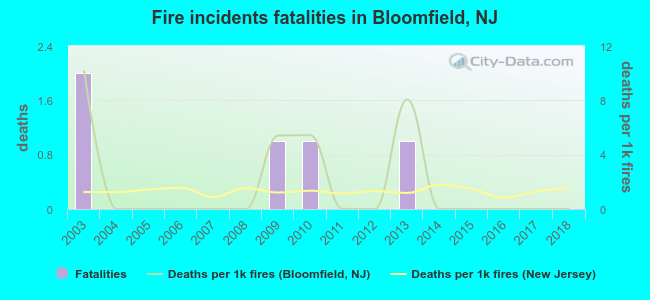 Based on the reports from the years 2003 - 2018 the average number of fire-related yearly deaths is 0. The highest number of reported deaths - 2 took place in 2003, and the lowest - 0 in 2004. The data has a decreasing trend.
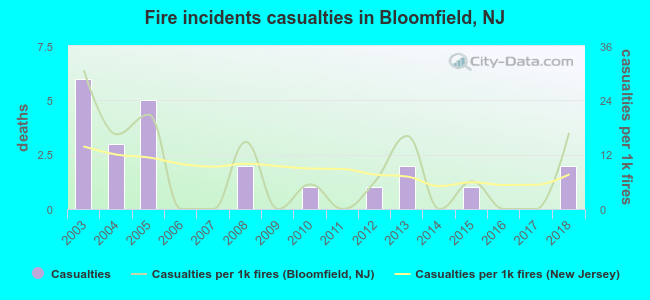 Based on the reports from the years 2003 - 2018 the average number of fire-related casualties per year is 1. The highest number of reported casualties - 6 took place in 2003, and the lowest - 0 in 2006. The data has a dropping trend.
The average number of injuries per 1,000 fire incidents is 8. This indicator was the highest - 30 in 2003, and the lowest 0 in 2006. The trend for injuries per 1,000 fire incidents is decreasing. Compared to the New Jersey value the number of injuries per 1,000 incidents is similar.
Based on the reports from the years 2003 - 2018 the average number of fire-related casualties per year is 1. The highest number of reported casualties - 6 took place in 2003, and the lowest - 0 in 2006. The data has a dropping trend.
The average number of injuries per 1,000 fire incidents is 8. This indicator was the highest - 30 in 2003, and the lowest 0 in 2006. The trend for injuries per 1,000 fire incidents is decreasing. Compared to the New Jersey value the number of injuries per 1,000 incidents is similar.Casualties per 1,000 incidents in Bloomfield, NJ compared to nearest cities:
(Note: Based on data for all years, including only cities with at least 500 fire incidents)
| Bloomfield: | 9.9 |
| Belleville: | 10.2 |
| Montclair: | 14.0 |
| Nutley: | 10.7 |
| East Orange: | 10.9 |
| Orange: | 6.0 |
| Lyndhurst: | 6.0 |
| West Orange: | 10.1 |
| Kearny: | 16.0 |
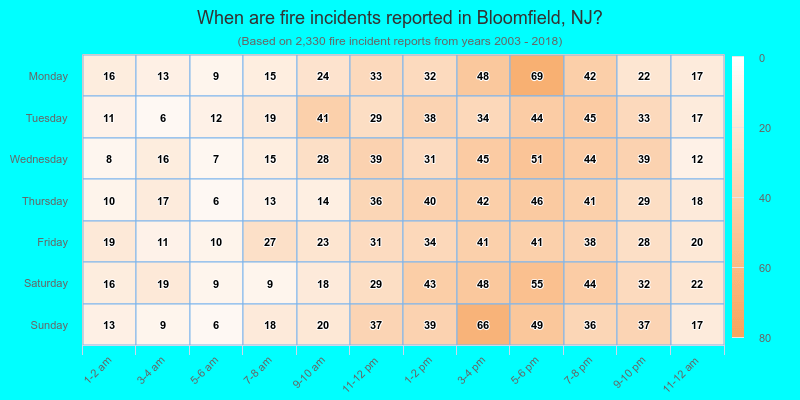
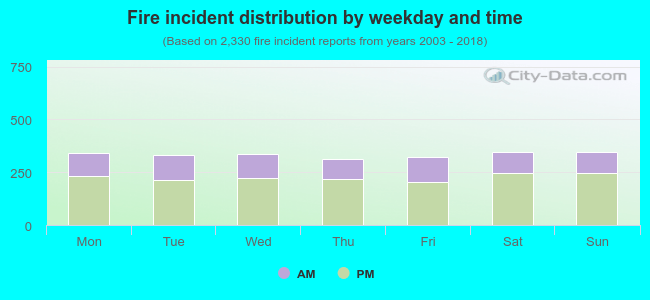 32.7% incidents where reported in the morning and 67.3% in the evening. The most fires (14.9%) took place on Sunday, and the least (13.4%) on Thursday.
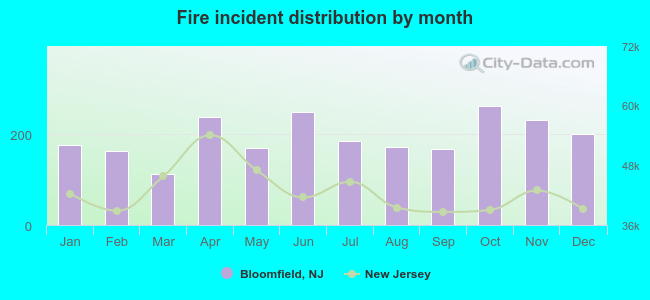 According to the 2,330 fires from years 2003 - 2018 most fires (11.3%) took place during October, and the least (4.8%) in March.
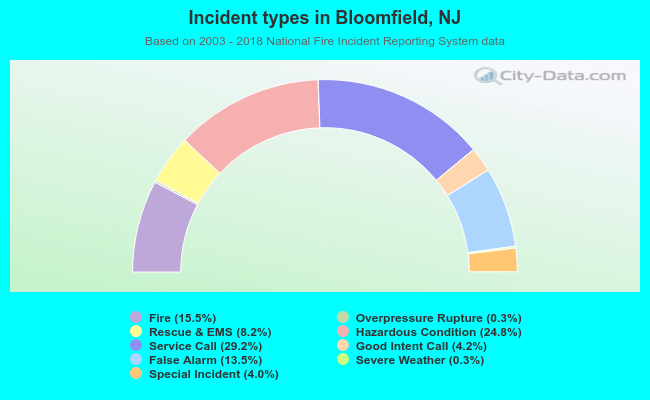 Out of all 15,033 cases reported during the years 2003 - 2018, the most belonged to the categories: Service Call (29.2%), Hazardous Condition (24.8%), and Fire (15.5%).
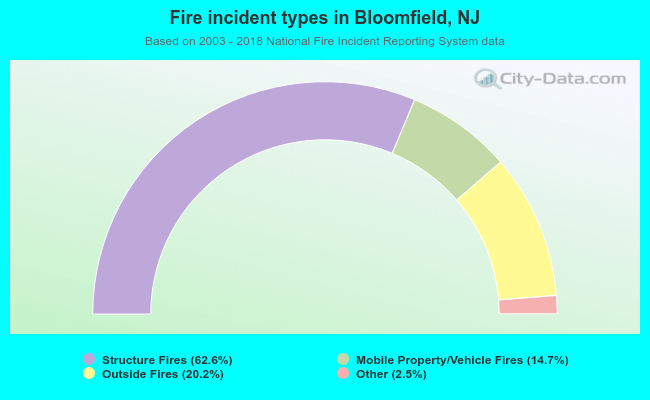 When looking into fire subcategories, the most reports belonged to: Structure Fires (62.6%), and Outside Fires (20.2%).