Blooming Prairie: Fire Incidents, Minnesota (MN)
Where are fire incidents reported in Blooming Prairie, MN
Something went wrong! Please refresh the page.
|
| |||||||||||||||||||||||||||||||||||||||||||||||||||||||||||||||||||||||||||||||||||||||||||||||||||||||||||||
2002 - 2018 National Fire Incident Reporting System (NFIRS) incidents
- Incident types reported to NFIRS in Blooming Prairie, MN
- 26756.7%Fire
- 5712.1%Rescue & EMS
- 5511.7%Hazardous Condition
- 408.5%Good Intent Call
- 296.2%False Alarm
- 112.3%Service Call
- 102.1%Severe Weather
- 20.4%Overpressure Rupture
- Fire incident types reported to NFIRS in Blooming Prairie, MN
- 10840.4%Structure Fires
- 10639.7%Outside Fires
- 4516.9%Mobile Property/Vehicle Fires
- 83.0%Other
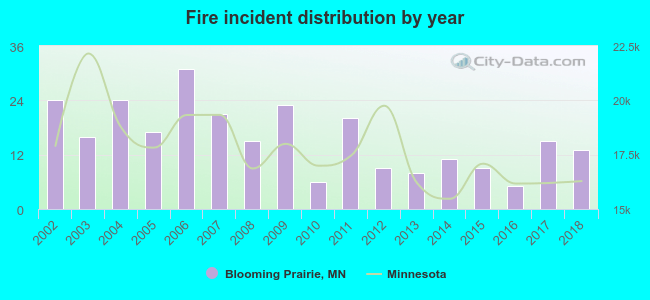 Based on the data from the years 2002 - 2018 the average number of fire incidents per year is 16. The highest number of fires - 31 took place in 2006, and the least - 5 in 2016. The data has a declining trend.
 29.6% incidents where reported in the morning and 70.4% in the evening. The most fires (18.4%) took place on Thursday, and the least (11.6%) on Friday.
 According to the 267 fires from years 2002 - 2018 most fires (19.9%) took place during April, and the least (3.0%) in February.
 Out of all 471 cases reported during the years 2002 - 2018, the most belonged to the categories: Fire (56.7%), Rescue & EMS (12.1%), and Hazardous Condition (11.7%).
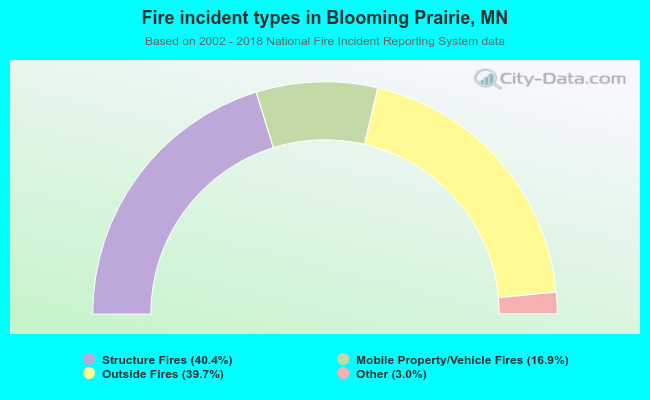 When looking into fire subcategories, the most incidents belonged to: Structure Fires (40.4%), and Outside Fires (39.7%).