| Fire incidents reported |
|---|
| Sreet name | Count |
|---|
| BURLINGHAM RD | 54 | | MAIN ST | 48 | | WINTERTON RD | 38 | | SHAWANGA LODGE RD | 36 | | 17 RT | 28 | | ROOSA GAP RD | 26 | | BLOOMINGBURG RD | 24 | | YORK RD | 24 | | RT 17 | 22 | | MOUNTAIN RD | 18 | | NA SHO PA RD | 18 | | 17K RT | 16 | | WALKER VALLEY RD | 16 | | FIRE TOWER RD | 12 | | RT 17 EXIT 114 | 12 | | SKI RUN RD | 12 | | TWIN LAKES TRL | 12 | | HIGH VIEW TER | 10 | | OLD ROOSA GAP RD | 10 | | PETTICOAT LANE | 10 | | DEER PATH CT | 8 | | DOSEN RD | 8 | | GOSHEN TURNPIKE | 8 | | KIMBERLY CT | 8 | | LONG LANE | 8 |
| | | Fire incidents reported |
|---|
| Sreet name | Count |
|---|
| PONDEROSA RD | 8 | | RT 17 EXIT 115 | 8 | | TREE TOP TRL | 8 | | WHITE BIRCH TRL | 8 | | ANTONELLI CT | 6 | | BLOOMINGBURG FIRE HOUSE | 6 | | BURLINGHAM RD | 6 | | COX RD | 6 | | DOLL RD | 6 | | ECHO RD | 6 | | FREY RD | 6 | | GODFREY RD | 6 | | JAMES CLARK DR | 6 | | MAMAKATING RD | 6 | | PATRICK DR | 6 | | PROSPEROUS VALLEY RD | 6 | | REGINA DR | 6 | | STONE SCHOOLHOUSE RD | 6 | | VALLEY VIEW | 6 | | ASPEN DR | 4 | | BALLARD RD | 4 | | BLOOMINGBURG FIRE DISTRICT | 4 | | BORIS RD | 4 | | BUTTONWOOD RD | 4 | | |
|
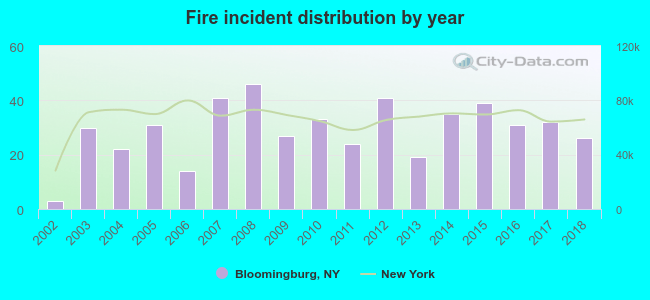 According to the data from the years 2002 - 2018 the average number of fires per year is 29. The highest number of reported fire incidents - 46 took place in 2008, and the least - 3 in 2002. The data has a rising trend.
 30.2% incidents where reported in the morning and 69.8% in the evening. The most fires (17.4%) took place on Saturday, and the least (10.3%) on Tuesday.
 Based on the 494 fire incidents from years 2002 - 2018 most fires (16.4%) took place during April, and the least (4.7%) in June.
 Out of all 2,163 cases reported during the years 2002 - 2018, the most belonged to the categories: Rescue & EMS (26.4%), Hazardous Condition (26.2%), and Fire (22.8%).
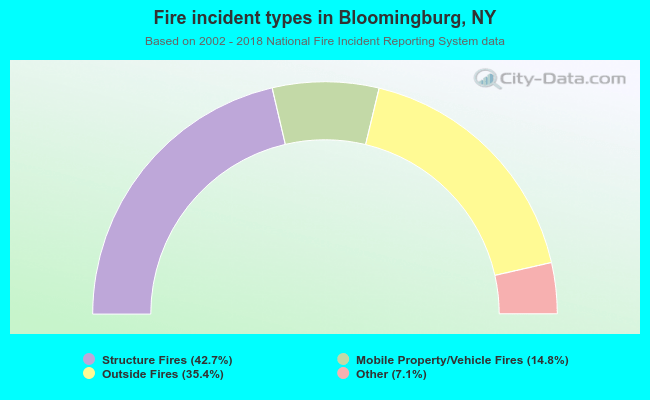 When looking into fire subcategories, the most reports belonged to: Structure Fires (42.7%), and Outside Fires (35.4%).