Bloomingdale: Fire Incidents, Indiana (IN)
Where are fire incidents reported in Bloomingdale, IN
Something went wrong! Please refresh the page.
|
| |||||||||||||||||||||||||||||||||||||||||||||||||||||||||||||||||||||||||||||||||||||||||||||||||||||||||||||
2002 - 2018 National Fire Incident Reporting System (NFIRS) incidents
- Incident types reported to NFIRS in Bloomingdale, IN
- 28249.9%Rescue & EMS
- 21938.8%Fire
- 244.2%Hazardous Condition
- 183.2%Good Intent Call
- 132.3%Service Call
- 81.4%False Alarm
- 10.2%Overpressure Rupture
- Fire incident types reported to NFIRS in Bloomingdale, IN
- 10648.4%Structure Fires
- 9041.1%Outside Fires
- 198.7%Mobile Property/Vehicle Fires
- 41.8%Other
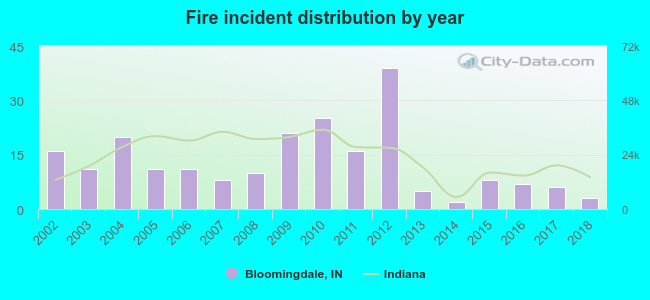 According to the data from the years 2002 - 2018 the average number of fires per year is 13. The highest number of reported fire incidents - 39 took place in 2012, and the least - 2 in 2014. The data has a declining trend.
 29.7% incidents where reported in the morning and 70.3% in the evening. The most fires (21.5%) took place on Thursday, and the least (10.0%) on Monday.
 Based on the 219 incident reports from years 2002 - 2018 most fires (19.2%) took place during March, and the least (3.2%) in August.
 Out of all 565 cases reported during the years 2002 - 2018, the most belonged to the categories: Rescue & EMS (49.9%), Fire (38.8%), and Hazardous Condition (4.2%).
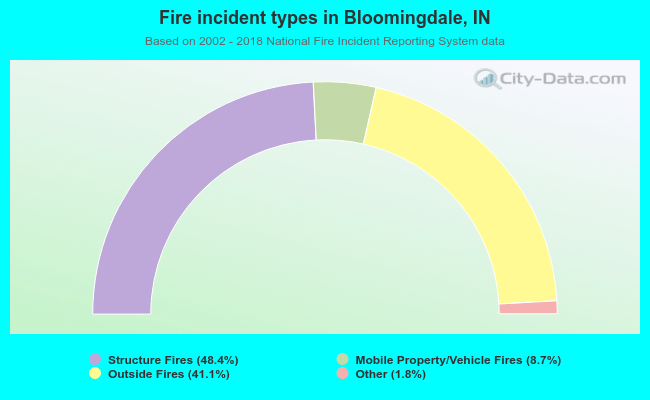 When looking into fire subcategories, the most incidents belonged to: Structure Fires (48.4%), and Outside Fires (41.1%).