| Fire incidents reported |
|---|
| Sreet name | Count |
|---|
| SAMPSON RD | 24 | | FORD RD | 22 | | MAIN ST | 22 | | VALLEY BLVD | 20 | | BLOWING ROCK BLVD | 16 | | BLACKBERRY RD | 12 | | U.S. HWY 321 HWY | 12 | | CHESTNUT DR | 10 | | FLAT TOP RD | 10 | | GLOBE RD | 10 | | US HWY 321 HWY | 10 | | SUNSET DR | 8 | | TWEETSIE RAILROAD LN | 8 | | AHO RD | 6 | | DAMERON DR | 6 | | GORGE VIEW DR | 6 | | GREEN HILL RD | 6 | | MOUNTAIN VIEW RD | 6 | | NIGHTINGALE LN | 6 | | PENLEY RD | 6 | | ROYAL OAKS DR | 6 | | US HWY 221 S | 6 | | WHITE ROCK RD | 6 | | 321S HWY | 4 | | ALPINE DR | 4 |
| | | Fire incidents reported |
|---|
| Sreet name | Count |
|---|
| CENTER COURT DR | 4 | | CHETOLA LAKE DR | 4 | | CLARENCE NEWTON RD | 4 | | COUNTRY CLUB DR | 4 | | GOFORTH RD | 4 | | GOLDEN RIDGE RD | 4 | | GREEN ST | 4 | | HUGHES RD | 4 | | LITTLE LAUREL RD | 4 | | MISTY RIDGE LANE | 4 | | MORNINGSIDE DR | 4 | | NILEY COOK RD | 4 | | PAYNE BRANCH RD | 4 | | PHEASANT LN | 4 | | REYNOLDS PKY | 4 | | SADDLE HILLS RD | 4 | | SAULS CAMP RD | 4 | | SKI MTN RD | 4 | | STRAWBERRY PATH | 4 | | SUMPTER CABIN CREEK | 4 | | THE PRESERVE RD | 4 | | U.S. HWY 221 HWY | 4 | | US 321 | 4 | | US 321 HWY | 4 | | |
|
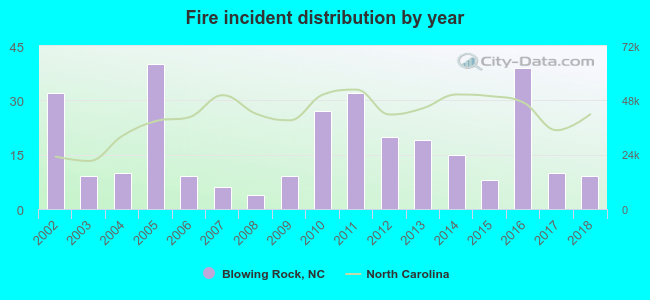 Based on the data from the years 2002 - 2018 the average number of fire incidents per year is 18. The highest number of reported fires - 40 took place in 2005, and the least - 4 in 2008. The data has a decreasing trend.
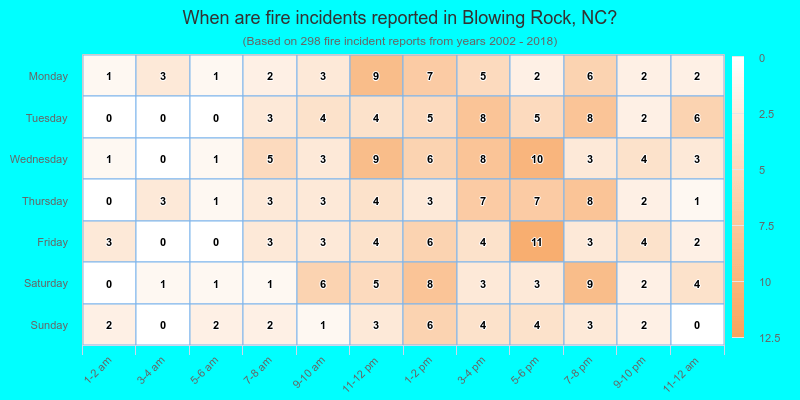
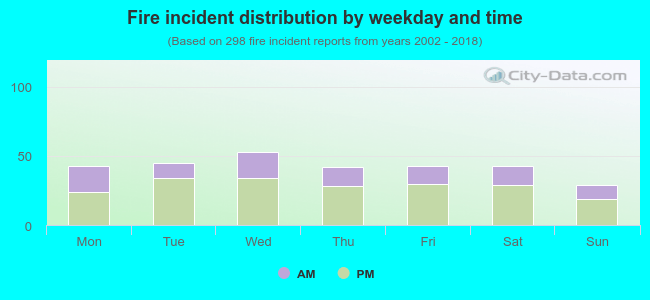 33.6% incidents where reported in the morning and 66.4% in the evening. The most fires (17.8%) took place on Wednesday, and the least (9.7%) on Sunday.
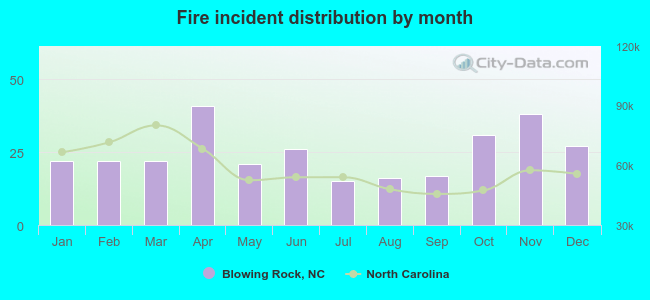 Based on the 298 fire incident reports from years 2002 - 2018 most fires (13.8%) took place during April, and the least (5.0%) in July.
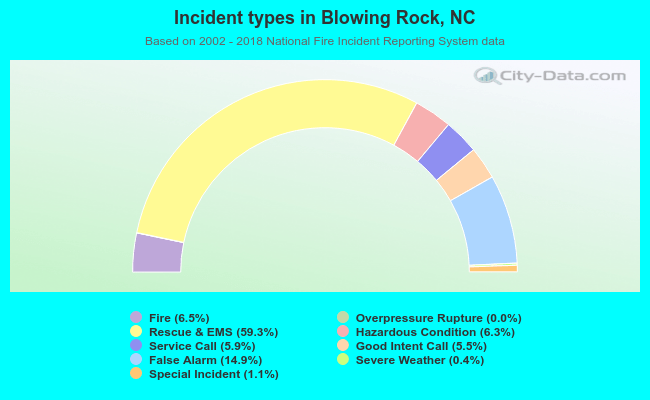 Out of all 4,552 cases reported during the years 2002 - 2018, the most belonged to the categories: Rescue & EMS (59.3%), False Alarm (14.9%), and Fire (6.5%).
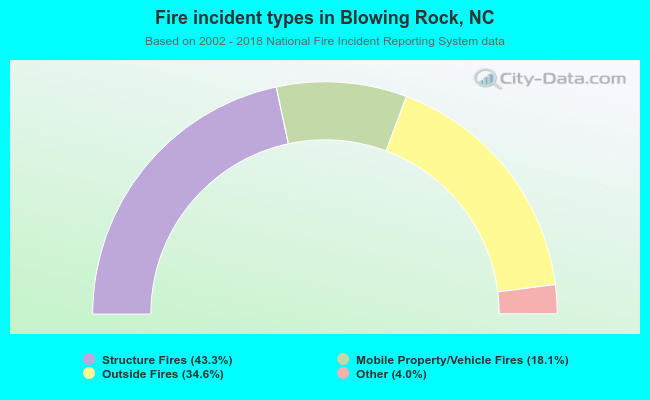 When looking into fire subcategories, the most reports belonged to: Structure Fires (43.3%), and Outside Fires (34.6%).