Blue Ash: Fire Incidents, Ohio (OH)
Where are fire incidents reported in Blue Ash, OH
Something went wrong! Please refresh the page.
| Fire incidents reported | |
|---|---|
| Sreet name | Count |
| BLUE ASH RD | 146 |
| HUNT RD | 116 |
| KENWOOD RD | 106 |
| COOPER RD | 102 |
| CORNELL RD | 90 |
| CREEK RD | 88 |
| REED HARTMAN (NORTH) HWY | 74 |
| ALLIANCE RD | 72 |
| KENWOOD (NORTH) RD | 64 |
| LAKE FOREST DR | 46 |
| DEERFIELD RD | 40 |
| KENWOOD (SOUTH) RD | 40 |
| GLENDALE-MILFORD RD | 38 |
| REED HARTMAN HWY | 32 |
| PFEIFFER RD | 30 |
| HUNTERS CREEK DR | 28 |
| DEERCROSS PKY | 26 |
| FOX RUN DR | 24 |
| GROOMS RD | 24 |
| PLAINFIELD (SOUTH) RD | 22 |
| SHELL RD | 22 |
| CORNELL PARK DR | 20 |
| GLENDALE MILFORD RD | 20 |
| GEORGETOWN RD | 18 |
| WILLIAMSON RD | 18 |
| ELLMAN AVE | 16 |
| KENRIDGE DR | 16 |
| KENWOOD | 16 |
| RONALD REAGAN HWY | 16 |
| ALMA AVE | 14 |
2002 - 2018 National Fire Incident Reporting System (NFIRS) incidents
- Incident types reported to NFIRS in Blue Ash, OH
- 4,49041.0%Rescue & EMS
- 2,40522.0%False Alarm
- 1,80516.5%Hazardous Condition
- 1,17110.7%Fire
- 7346.7%Good Intent Call
- 2692.5%Service Call
- 380.3%Overpressure Rupture
- 340.3%Special Incident
- Fire incident types reported to NFIRS in Blue Ash, OH
- 61952.9%Structure Fires
- 38733.0%Outside Fires
- 16213.8%Mobile Property/Vehicle Fires
- 30.3%Other
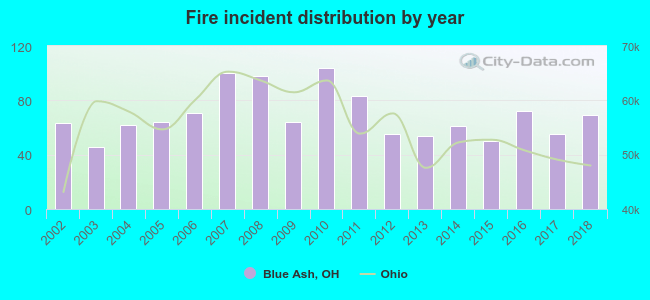 According to the data from the years 2002 - 2018 the average number of fires per year is 69. The highest number of fires - 104 took place in 2010, and the least - 46 in 2003. The data has an increasing trend.
The average number of yearly fire incidents per 10k residents in Blue Ash, OH compared to nearest cities:
(Note: Based on data for the last 3 years, including only cities with population 5,000 and above)
| Blue Ash: | 53.8 |
| Montgomery: | 22.3 |
| Sharonville: | 65.8 |
| Deer Park: | 26.9 |
| Reading: | 56.7 |
| Madeira: | 11.9 |
| Wyoming: | 21.0 |
| Loveland: | 55.1 |
| Springdale: | 78.8 |
 The median response time based on all reported fire incidents is 5 minutes. This is lower than the Ohio median value.
The median response time in Blue Ash, OH compared to nearest cities:
(Note: Based on data for all years, including only cities with at least 500 fire incidents)
| Blue Ash: | 5 minutes |
| Montgomery: | 6 minutes |
| Sharonville: | 6 minutes |
| Evendale: | 5 minutes |
| Reading: | 5 minutes |
| Lincoln Heights: | 5 minutes |
| Lockland: | 6 minutes |
| Woodlawn: | 5 minutes |
| Wyoming: | 5 minutes |
 Based on the reports from the years 2002 - 2018 the average number of fire-related yearly casualties is 2. The highest number of reported casualties - 5 took place in 2008, and the lowest - 0 in 2009. The data has a dropping trend.
The average number of injuries per 1,000 fires is 27. This indicator was the highest - 65 in 2003, and the lowest 0 in 2009. The trend for casualties per 1,000 fires is decreasing. Compared to the Ohio value the number of injuries per 1,000 fire incidents is higher.
Based on the reports from the years 2002 - 2018 the average number of fire-related yearly casualties is 2. The highest number of reported casualties - 5 took place in 2008, and the lowest - 0 in 2009. The data has a dropping trend.
The average number of injuries per 1,000 fires is 27. This indicator was the highest - 65 in 2003, and the lowest 0 in 2009. The trend for casualties per 1,000 fires is decreasing. Compared to the Ohio value the number of injuries per 1,000 fire incidents is higher.Casualties per 1,000 incidents in Blue Ash, OH compared to nearest cities:
(Note: Based on data for all years, including only cities with at least 500 fire incidents)
| Blue Ash: | 25.6 |
| Montgomery: | 4.6 |
| Sharonville: | 6.8 |
| Evendale: | 3.7 |
| Reading: | 40.6 |
| Lincoln Heights: | 0.0 |
| Lockland: | 11.9 |
| Woodlawn: | 3.8 |
| Wyoming: | 6.8 |
 32.1% incidents where reported in the morning and 67.9% in the evening. The most fires (18.8%) took place on Tuesday, and the least (9.6%) on Sunday.
 According to the 1,171 reports from years 2002 - 2018 most fires (11.0%) took place during June, and the least (6.2%) in October.
 Out of all 10,953 cases reported during the years 2002 - 2018, the most belonged to the categories: Rescue & EMS (41.0%), False Alarm (22.0%), and Hazardous Condition (16.5%).
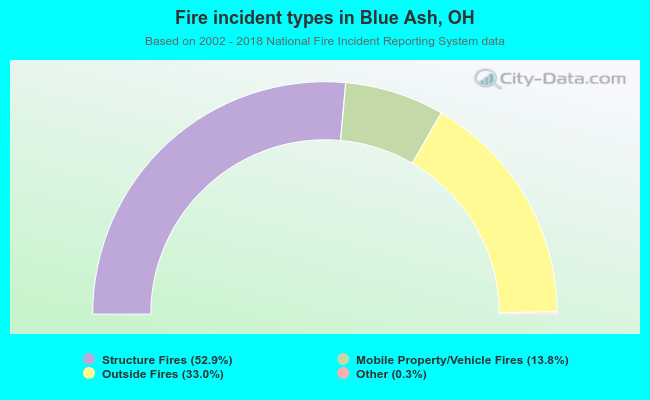 When looking into fire subcategories, the most incidents belonged to: Structure Fires (52.9%), and Outside Fires (33.0%).