| Fire incidents reported |
|---|
| Sreet name | Count |
|---|
| 16067 CR 225 | 8 | | 16067 CR225 | 8 | | 22058 CR 130 | 6 | | 405 E 4TH ST | 6 | | 17050 CR 220 | 4 | | 19299 HWY W | 4 | | 19299 W HWY | 4 | | 20292 HWY 65 | 4 | | 20598 CR 173 | 4 | | 20598 CR173 | 4 | | 21344 CR154 | 4 | | 21534 CR182 | 4 | | 401 S MAIN | 4 | | CR 280 | 4 | | 1 | 2 | | 1 1/2 M N OF W ON CR223 | 2 | | 1 1/2 MILE N WEST | 2 | | 112 2ND ST. | 2 | | 13257 CR 201 | 2 | | 16094 C HWY. | 2 | | 17119 CR 167 | 2 | | 17119 CR167 | 2 | | 17303 HWY T | 2 | | 17484 CR 180 | 2 | | 17800 CR 223 | 2 |
| | | Fire incidents reported |
|---|
| Sreet name | Count |
|---|
| 17813 HWY W | 2 | | 17847 CR261 | 2 | | 18304 CR 170 | 2 | | 18399 CR 261 | 2 | | 18499 HWY 65 | 2 | | 18543 CR 171 | 2 | | 18638 CR 211 | 2 | | 18705 HWY W | 2 | | 18758 CR 171 | 2 | | 18876 CR212 | 2 | | 18990 CR170 | 2 | | 19001 CR223 | 2 | | 19282 CR160 | 2 | | 19289 CR160 | 2 | | 19299 HIGHWAY W | 2 | | 19317 CR261 | 2 | | 19536 CR 144 | 2 | | 19645 N US65 | 2 | | 19649 CR171 | 2 | | 19651 CR 144 | 2 | | 19759 CR 130 | 2 | | 19759 CR130 | 2 | | 19788 CR 170 | 2 | | 19788 CR170 | 2 | | |
|
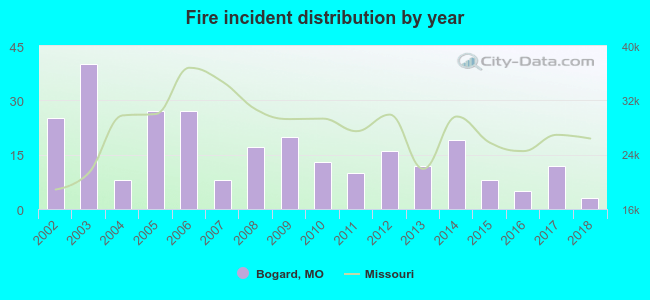 According to the data from the years 2002 - 2018 the average number of fires per year is 16. The highest number of fires - 40 took place in 2003, and the least - 3 in 2018. The data has a dropping trend.
 23.7% incidents where reported in the morning and 76.3% in the evening. The most fires (15.9%) took place on Saturday, and the least (11.9%) on Thursday.
 Based on the 270 fire incidents from years 2002 - 2018 most fires (27.0%) took place during March, and the least (4.1%) in November.
 Out of all 345 cases reported during the years 2002 - 2018, the most belonged to the categories: Fire (78.3%), Rescue & EMS (8.7%), and Hazardous Condition (7.0%).
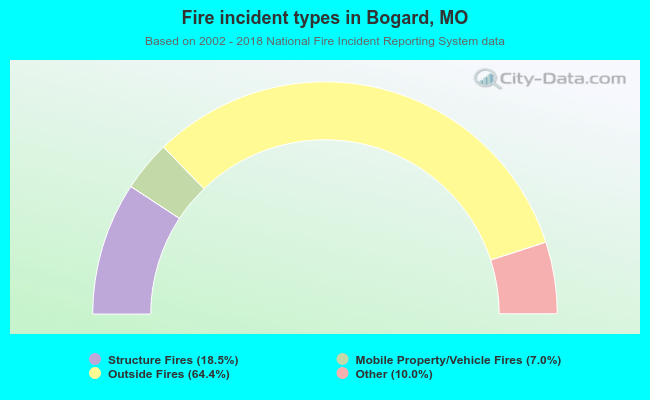 When looking into fire subcategories, the most reports belonged to: Outside Fires (64.4%), and Structure Fires (18.5%).