Bolton: Fire Incidents, Connecticut (CT)
Where are fire incidents reported in Bolton, CT
Something went wrong! Please refresh the page.
|
| |||||||||||||||||||||||||||||||||||||||||||||||||||||||||||||||||||||||||||||||||||||||||||||||||||||||||||||
2002 - 2018 National Fire Incident Reporting System (NFIRS) incidents
- Incident types reported to NFIRS in Bolton, CT
- 1,40050.7%Rescue & EMS
- 46516.8%Hazardous Condition
- 43515.8%Fire
- 1886.8%Service Call
- 1455.3%False Alarm
- 1033.7%Good Intent Call
- 170.6%Special Incident
- 50.2%Severe Weather
- Fire incident types reported to NFIRS in Bolton, CT
- 22752.2%Structure Fires
- 11326.0%Outside Fires
- 5212.0%Mobile Property/Vehicle Fires
- 439.9%Other
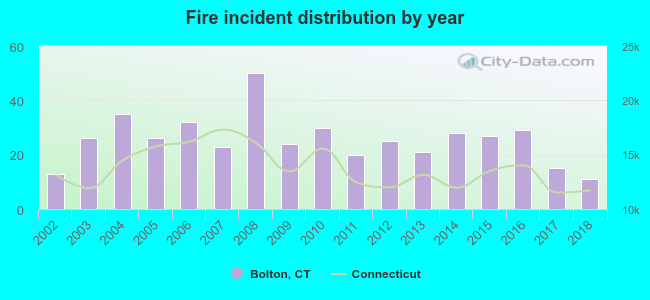 According to the data from the years 2002 - 2018 the average number of fires per year is 26. The highest number of fires - 50 took place in 2008, and the least - 11 in 2018. The data has a declining trend.
 Based on the reports from the years 2002 - 2018 the average number of fire-related yearly casualties is 0. The highest number of reported injuries - 1 took place in 2003, and the lowest - 0 in 2002. The data has a constant trend.
 27.6% incidents where reported in the morning and 72.4% in the evening. The most fires (19.1%) took place on Wednesday, and the least (9.4%) on Tuesday.
 According to the 435 fire incident reports from years 2002 - 2018 most fires (12.2%) took place during March, and the least (4.1%) in September.
 Out of all 2,760 cases reported during the years 2002 - 2018, the most belonged to the categories: Rescue & EMS (50.7%), Hazardous Condition (16.8%), and Fire (15.8%).
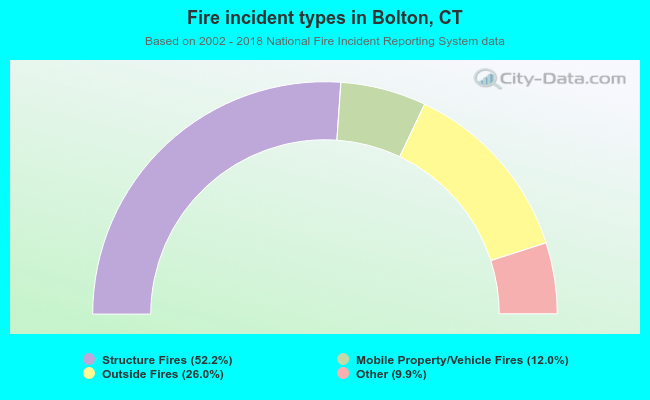 When looking into fire subcategories, the most reports belonged to: Structure Fires (52.2%), and Outside Fires (26.0%).