| Fire incidents reported |
|---|
| Sreet name | Count |
|---|
| LAKE SHORE DR | 42 | | ON LAKE GEORGE | 20 | | LAKESHORE DR | 10 | | NEW VERMONT RD | 10 | | SAGAMORE RD | 10 | | SAGAMORE RD | 10 | | TROUT LAKE RD | 10 | | EAST SCHROON RIVER RD | 8 | | NORTH BOLTON RD | 8 | | LAKE SHORE DR | 6 | | NORTH BOLTON RD | 6 | | COOLIDGE HILL RD | 4 | | COOLIDGE HILL RD | 4 | | COOLIDGE HILL ROAD | 4 | | COUNTY ROUTE 11 | 4 | | DEERFIELD LANE | 4 | | DEERFIELD RD | 4 | | EAST SCHROON RIVER ROAD | 4 | | FINKLE RD | 4 | | GABBY RD | 4 | | HORICON AVE | 4 | | LAKE SHORE DRIVE | 4 | | LAMB HILL RD | 4 | | NEW VERMONT RD | 4 | | PADANARUM RD | 4 |
| | | Fire incidents reported |
|---|
| Sreet name | Count |
|---|
| SAGAMORE RD RD | 4 | | SAWMILL RD | 4 | | STEWART AVE | 4 | | TROUT LAKE RD | 4 | | VALLEY WOODS RD | 4 | | WEST DOLLAR ISLAND | 4 | | 110 SAGAMORE RD | 2 | | 16 CHURCH HILL RD | 2 | | 31 DEERFIELD RD | 2 | | 4104 LAKE SHORE DR | 2 | | 419 PADANARUM RD | 2 | | 5003 LAKE SHORE DRIVE | 2 | | 5413 STATE ROUTE 9N | 2 | | 8 BIRCH DRIVE | 2 | | ACORN DR DR | 2 | | BELL POINT BEACH | 2 | | BELL POINT ROAD | 2 | | BELLE LODI LN | 2 | | BIRCH DR DR | 2 | | BRAILEY POINT LN | 2 | | BRALEY HILL RD | 2 | | BRALEY POINT RD | 2 | | BROOK STREET EXTENSION | 2 | | BURCH DR | 2 | | |
|
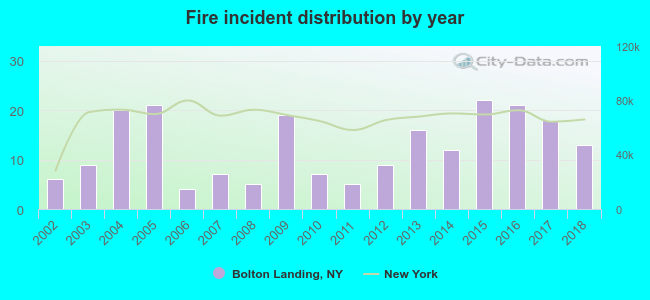 Based on the data from the years 2002 - 2018 the average number of fires per year is 13. The highest number of reported fire incidents - 22 took place in 2015, and the least - 4 in 2006. The data has a growing trend.
 27.1% incidents where reported in the morning and 72.9% in the evening. The most fires (17.3%) took place on Sunday, and the least (8.9%) on Wednesday.
 Based on the 214 incident reports from years 2002 - 2018 most fires (16.8%) took place during May, and the least (3.3%) in February.
 Out of all 895 cases reported during the years 2002 - 2018, the most belonged to the categories: Fire (23.9%), Good Intent Call (22.9%), and Overpressure Rupture (21.1%).
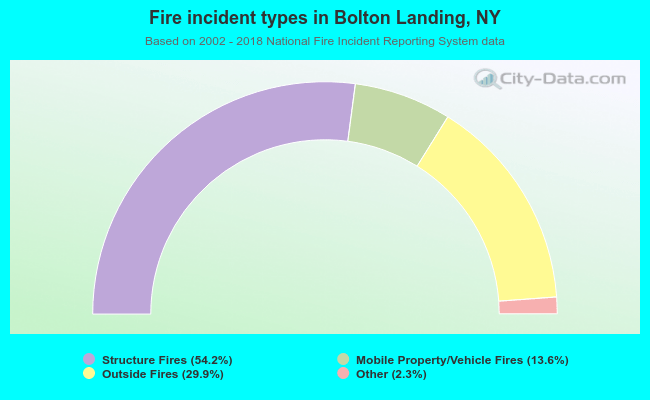 When looking into fire subcategories, the most incidents belonged to: Structure Fires (54.2%), and Outside Fires (29.9%).