Boonville: Fire Incidents, Missouri (MO)
Where are fire incidents reported in Boonville, MO
Something went wrong! Please refresh the page.
|
| |||||||||||||||||||||||||||||||||||||||||||||||||||||||||||||||||||||||||||||||||||||||||||||||||||||||||||||
| Other | 340 | |||||||||||||||||||||||||||||||||||||||||||||||||||||||||||||||||||||||||||||||||||||||||||||||||||||||||||||
2002 - 2018 National Fire Incident Reporting System (NFIRS) incidents
- Incident types reported to NFIRS in Boonville, MO
- 4,23560.2%Rescue & EMS
- 89812.8%Fire
- 81011.5%Good Intent Call
- 6649.4%Hazardous Condition
- 2583.7%False Alarm
- 1341.9%Service Call
- 240.3%Overpressure Rupture
- 110.2%Severe Weather
- Fire incident types reported to NFIRS in Boonville, MO
- 37842.1%Outside Fires
- 24327.1%Mobile Property/Vehicle Fires
- 22925.5%Structure Fires
- 485.3%Other
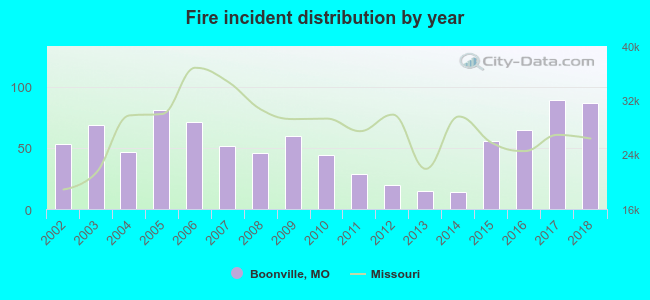 Based on the data from the years 2002 - 2018 the average number of fire incidents per year is 53. The highest number of fires - 89 took place in 2017, and the least - 14 in 2014. The data has a growing trend.
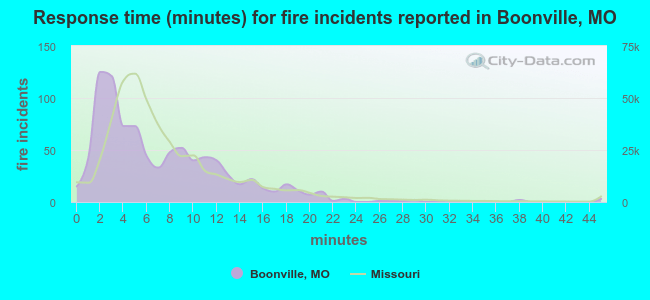 The median response time based on all reported fire incidents is 5 minutes. This is lower compared to the state median value.
The median response time in Boonville, MO compared to nearest cities:
(Note: Based on data for all years, including only cities with at least 500 fire incidents)
| Boonville: | 5 minutes |
| Columbia: | 5 minutes |
| California: | 7 minutes |
| Marshall: | 4 minutes |
| Sedalia: | 5 minutes |
| Moberly: | 5 minutes |
| Versailles: | 9 minutes |
| Stover: | 12 minutes |
| Holts Summit: | 9 minutes |
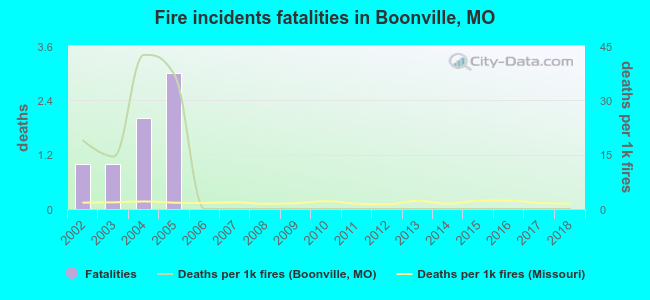 According to the data from the years 2002 - 2018 the average number of fire-related yearly deaths is 0. The highest number of reported deaths - 3 took place in 2005, and the lowest - 0 in 2006. The data has a dropping trend.
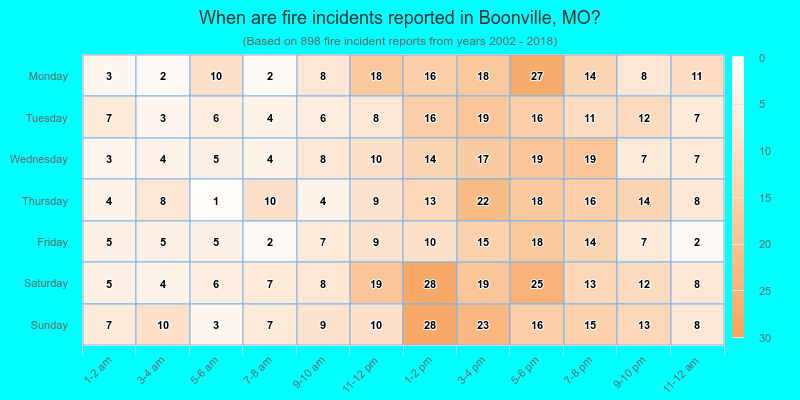
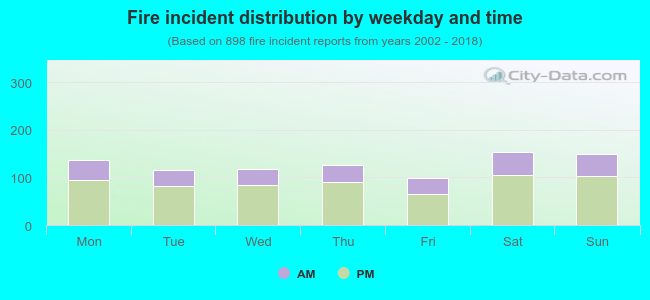 30.6% incidents where reported in the morning and 69.4% in the evening. The most fires (17.1%) took place on Saturday, and the least (11.0%) on Friday.
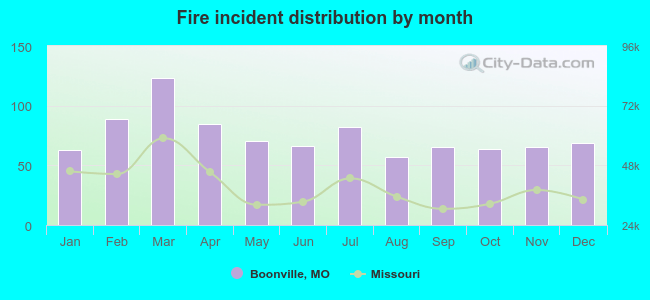 Based on the 898 fire incidents from years 2002 - 2018 most fires (13.7%) took place during March, and the least (6.3%) in August.
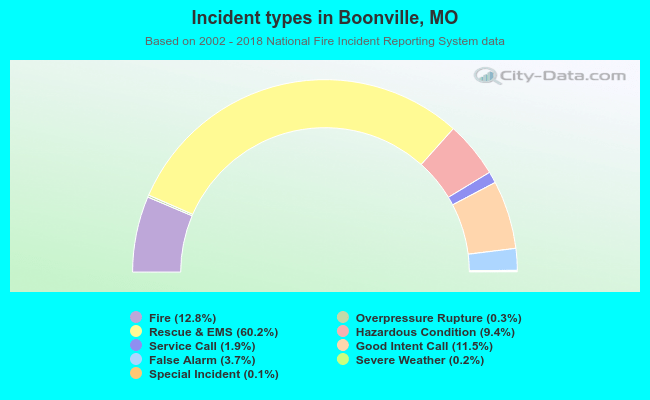 Out of all 7,040 cases reported during the years 2002 - 2018, the most belonged to the categories: Rescue & EMS (60.2%), Fire (12.8%), and Good Intent Call (11.5%).
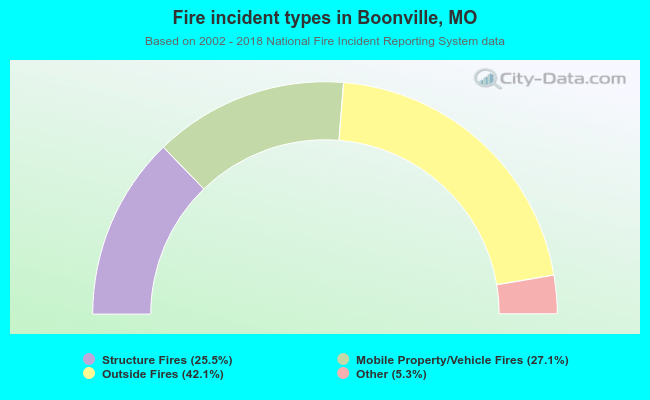 When looking into fire subcategories, the most reports belonged to: Outside Fires (42.1%), and Mobile Property/Vehicle Fires (27.1%).