Boswell: Fire Incidents, Indiana (IN)
Where are fire incidents reported in Boswell, IN
Something went wrong! Please refresh the page.
|
| |||||||||||||||||||||||||||||||||||||||||||||||||||||||||||||||||||||||||||||||||||||||||||||||||||||||||||||
2002 - 2018 National Fire Incident Reporting System (NFIRS) incidents
- Incident types reported to NFIRS in Boswell, IN
- 16864.9%Fire
- 4316.6%Service Call
- 228.5%Hazardous Condition
- 114.2%Good Intent Call
- 93.5%Rescue & EMS
- 31.2%False Alarm
- 20.8%Special Incident
- 10.4%Severe Weather
- Fire incident types reported to NFIRS in Boswell, IN
- 7544.6%Outside Fires
- 5130.4%Structure Fires
- 3118.5%Mobile Property/Vehicle Fires
- 116.5%Other
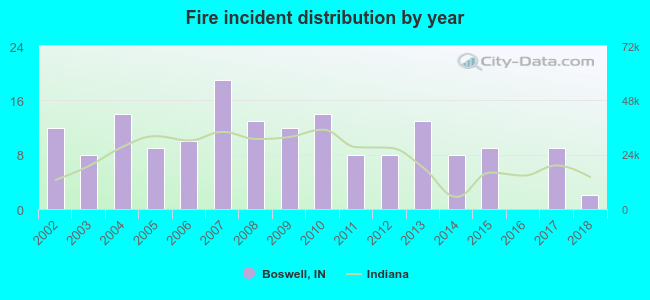 According to the data from the years 2002 - 2018 the average number of fires per year is 10. The highest number of fire incidents - 19 took place in 2007, and the least - 0 in 2016. The data has a decreasing trend.
 34.5% incidents where reported in the morning and 65.5% in the evening. The most fires (19.6%) took place on Thursday, and the least (9.5%) on Wednesday.
 Based on the 168 fire incident reports from years 2002 - 2018 most fires (14.3%) took place during April, and the least (4.8%) in December.
 Out of all 259 cases reported during the years 2002 - 2018, the most belonged to the categories: Fire (64.9%), Hazardous Condition (16.6%), and Rescue & EMS (8.5%).
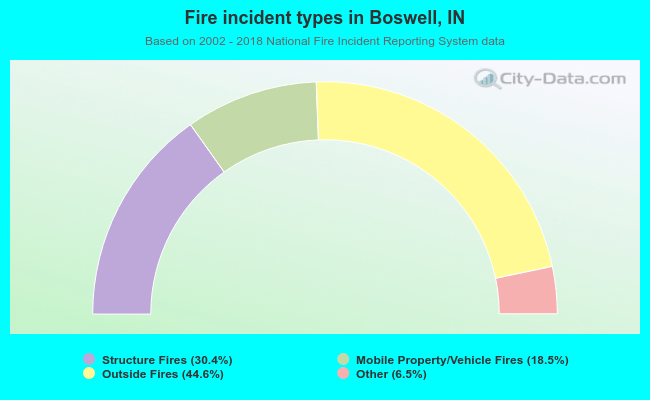 When looking into fire subcategories, the most incidents belonged to: Outside Fires (44.6%), and Structure Fires (30.4%).