| Fire incidents reported |
|---|
| Sreet name | Count |
|---|
| 207 W GROSSMAN | 8 | | UU HWY | 8 | | HWY M | 6 | | 17064 CR 311 | 4 | | 19823 CR 321 | 4 | | 19886 CR231 | 4 | | 207 MISSOURI ST | 4 | | 209 N MATHIESON | 4 | | 22711 HWY UU | 4 | | 302 EAST JEFFERSON | 4 | | 302 JEFFERSON | 4 | | 302 S. BAKER | 4 | | 306 SOUTH BAKER | 4 | | 309 W GROSSMAN | 4 | | 35464 CR 230 | 4 | | 36197 CR220 | 4 | | CR 160 | 4 | | CR 287 | 4 | | CR 291 M HWY | 4 | | CR 301 | 4 | | KANSAS STREET AT THE TRACKS | 4 | | M BLACKTOP AND CR351 | 4 | | 104 MAPLE | 2 | | 104 S. MAPLE | 2 | | 105 CONGOR | 2 |
| | | Fire incidents reported |
|---|
| Sreet name | Count |
|---|
| 108 W GROSSMAN | 2 | | 108 WEST GROSSMAN | 2 | | 139 & CR 232 | 2 | | 139 & CR250 | 2 | | 139 CR230 | 2 | | 139 NORTH | 2 | | 15238 HWY 139 | 2 | | 15811 CR 351 | 2 | | 16150 HWY 139 | 2 | | 16683 NN HWY | 2 | | 17383 CR 344 | 2 | | 17877 CR321 | 2 | | 18327 CR281 | 2 | | 18354 CR 291 | 2 | | 18802 CR 341 | 2 | | 18802 CR341 | 2 | | 19386 CR357 | 2 | | 19732 HWY 139 | 2 | | 20 341 139 HIGHWAY | 2 | | 200 HURON STREET | 2 | | 20073 P HWY | 2 | | 202 N BECK | 2 | | 20231 CR 295 | 2 | | 205 N MATHIESON | 2 | | |
|
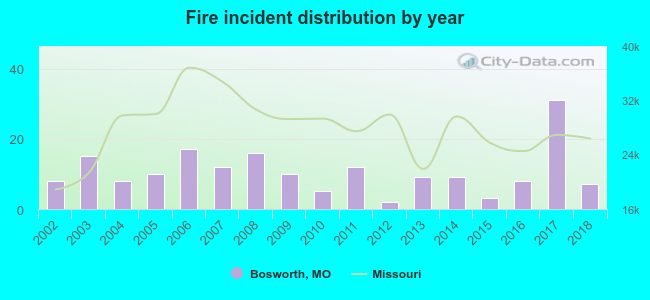 Based on the data from the years 2002 - 2018 the average number of fire incidents per year is 11. The highest number of fires - 31 took place in 2017, and the least - 2 in 2012. The data has a dropping trend.
 25.3% incidents where reported in the morning and 74.7% in the evening. The most fires (18.1%) took place on Saturday, and the least (11.5%) on Monday.
 Based on the 182 fire incident reports from years 2002 - 2018 most fires (19.2%) took place during March, and the least (3.3%) in October.
 Out of all 223 cases reported during the years 2002 - 2018, the most belonged to the categories: Fire (81.6%), Service Call (6.7%), and Overpressure Rupture (5.4%).
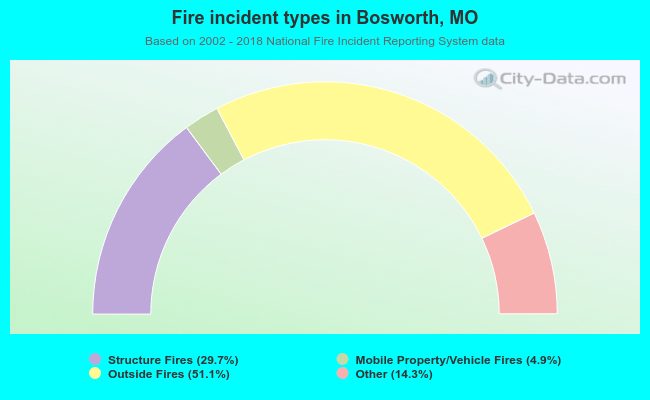 When looking into fire subcategories, the most reports belonged to: Outside Fires (51.1%), and Structure Fires (29.7%).