Botkins: Fire Incidents, Ohio (OH)
Where are fire incidents reported in Botkins, OH
Something went wrong! Please refresh the page.
|
| |||||||||||||||||||||||||||||||||||||||||||||||||||||||||||||||||||||||||||||||||||||||||||||||||||||||||||||
2002 - 2018 National Fire Incident Reporting System (NFIRS) incidents
- Incident types reported to NFIRS in Botkins, OH
- 39544.1%Fire
- 16718.6%Hazardous Condition
- 15917.7%Rescue & EMS
- 11612.9%Good Intent Call
- 323.6%False Alarm
- 151.7%Service Call
- 70.8%Overpressure Rupture
- 40.4%Special Incident
- 10.1%Severe Weather
- Fire incident types reported to NFIRS in Botkins, OH
- 17143.3%Structure Fires
- 15138.2%Outside Fires
- 6917.5%Mobile Property/Vehicle Fires
- 41.0%Other
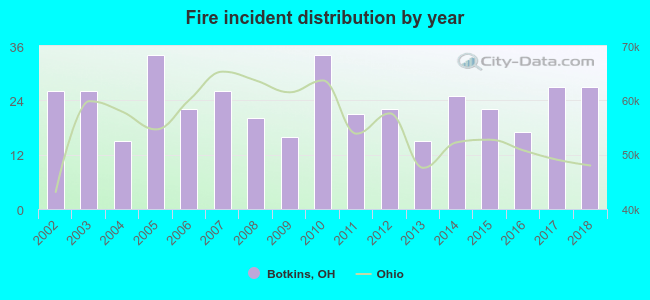 According to the data from the years 2002 - 2018 the average number of fires per year is 23. The highest number of fires - 34 took place in 2005, and the least - 15 in 2004. The data has an increasing trend.
 According to the reports from the years 2002 - 2018 the average number of fire-related casualties per year is 0. The highest number of casualties - 1 took place in 2002, and the lowest - 0 in 2003. The data has a decreasing trend.
 31.4% incidents where reported in the morning and 68.6% in the evening. The most fires (19.0%) took place on Saturday, and the least (11.4%) on Tuesday.
 Based on the 395 fires from years 2002 - 2018 most fires (15.7%) took place during July, and the least (5.3%) in December.
 Out of all 896 cases reported during the years 2002 - 2018, the most belonged to the categories: Fire (44.1%), Hazardous Condition (18.6%), and Rescue & EMS (17.7%).
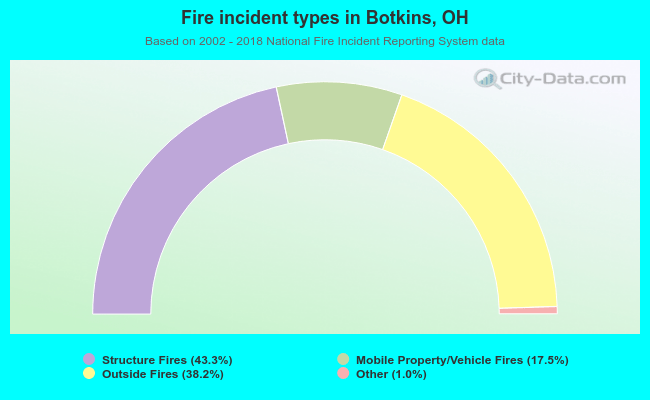 When looking into fire subcategories, the most reports belonged to: Structure Fires (43.3%), and Outside Fires (38.2%).