Bowerston: Fire Incidents, Ohio (OH)
Where are fire incidents reported in Bowerston, OH
Something went wrong! Please refresh the page.
|
| |||||||||||||||||||||||||||||||||||||||||||||||||||||||||||||||||||||||||||||||||||||||||||||||||||||||||||||
2002 - 2018 National Fire Incident Reporting System (NFIRS) incidents
- Incident types reported to NFIRS in Bowerston, OH
- 27740.6%Fire
- 20630.2%Rescue & EMS
- 9714.2%Hazardous Condition
- 405.9%Good Intent Call
- 274.0%Service Call
- 233.4%False Alarm
- 50.7%Severe Weather
- 40.6%Special Incident
- 30.4%Overpressure Rupture
- Fire incident types reported to NFIRS in Bowerston, OH
- 15455.6%Structure Fires
- 9534.3%Outside Fires
- 238.3%Mobile Property/Vehicle Fires
- 51.8%Other
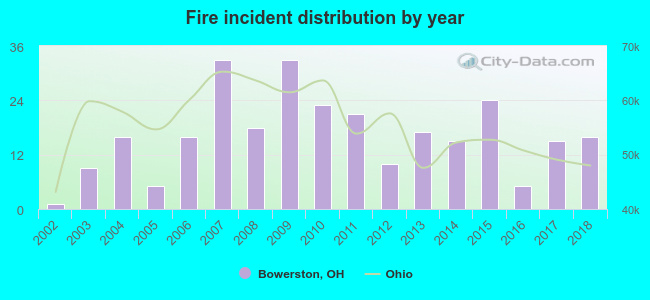 Based on the data from the years 2002 - 2018 the average number of fires per year is 16. The highest number of reported fire incidents - 33 took place in 2007, and the least - 1 in 2002. The data has a growing trend.
 27.4% incidents where reported in the morning and 72.6% in the evening. The most fires (17.3%) took place on Thursday, and the least (8.3%) on Saturday.
 Based on the 277 fire incidents from years 2002 - 2018 most fires (13.7%) took place during February, and the least (4.3%) in October.
 Out of all 682 cases reported during the years 2002 - 2018, the most belonged to the categories: Fire (40.6%), Rescue & EMS (30.2%), and Hazardous Condition (14.2%).
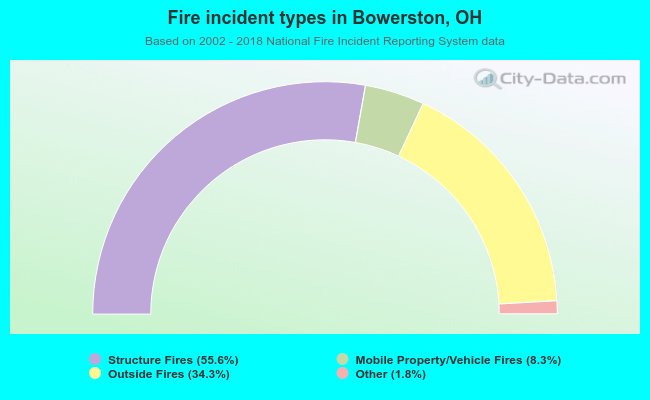 When looking into fire subcategories, the most incidents belonged to: Structure Fires (55.6%), and Outside Fires (34.3%).