Bowman: Fire Incidents, North Dakota (ND)
Where are fire incidents reported in Bowman, ND
Something went wrong! Please refresh the page.
|
| |||||||||||||||||||||||||||||||||||||||||||||||||||||||||||||||||||||||||||||||||||||||||||||||||||||||||||||
| Other | 56 | |||||||||||||||||||||||||||||||||||||||||||||||||||||||||||||||||||||||||||||||||||||||||||||||||||||||||||||
2002 - 2017 National Fire Incident Reporting System (NFIRS) incidents
- Incident types reported to NFIRS in Bowman, ND
- 29068.6%Fire
- 389.0%Special Incident
- 286.6%False Alarm
- 276.4%Hazardous Condition
- 215.0%Good Intent Call
- 143.3%Rescue & EMS
- 51.2%Service Call
- Fire incident types reported to NFIRS in Bowman, ND
- 19466.9%Outside Fires
- 5820.0%Structure Fires
- 3411.7%Mobile Property/Vehicle Fires
- 41.4%Other
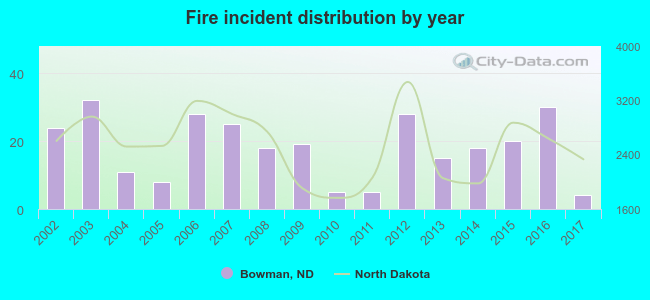 According to the data from the years 2002 - 2017 the average number of fires per year is 18. The highest number of fire incidents - 32 took place in 2003, and the least - 4 in 2017. The data has a declining trend.
 25.9% incidents where reported in the morning and 74.1% in the evening. The most fires (17.9%) took place on Saturday, and the least (10.3%) on Friday.
 Based on the 290 incident reports from years 2002 - 2017 most fires (25.2%) took place during July, and the least (2.8%) in January.
 Out of all 423 cases reported during the years 2002 - 2017, the most belonged to the categories: Fire (68.6%), False Alarm (9.0%), and Good Intent Call (6.6%).
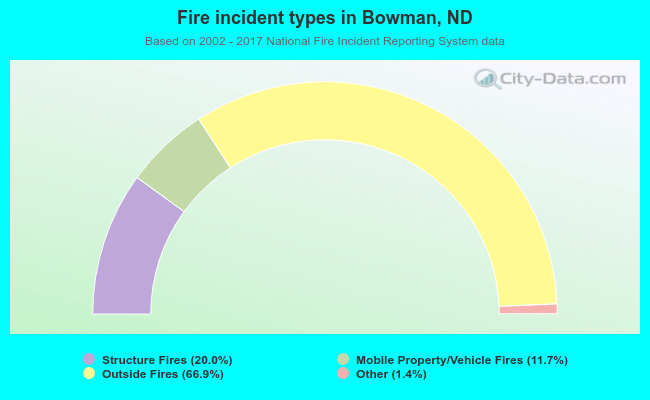 When looking into fire subcategories, the most incidents belonged to: Outside Fires (66.9%), and Structure Fires (20.0%).