| Fire incidents reported |
|---|
| Sreet name | Count |
|---|
| FULLERS MILL RD | 46 | | GRAHAM ST | 18 | | GENERAL THOMAS HWY | 16 | | BURNT REED RD | 14 | | MEHERRIN RD | 14 | | CLARKSBURY RD | 12 | | MAIN ST | 12 | | BEATON AVE | 10 | | CROSS KEYS RD | 10 | | OLD BRANCHVILLE RD | 10 | | PITTMAN RD | 10 | | GARRIS MILL RD | 8 | | VIRGINIA AVE | 8 | | VIRGINIA ST | 8 | | CABIN POND LN | 6 | | OLD PLACE RD | 6 | | PORTERHOUSE RD | 6 | | SERBIN ST | 6 | | #8 SCHOOLHOUSE RD | 4 | | BROAD ST | 4 | | BROOKSIDE DR | 4 | | BUSY ST | 4 | | CANDLELIGHT LN | 4 | | CIRCLE ST | 4 | | CROSS KEYS ROAD | 4 |
| | | Fire incidents reported |
|---|
| Sreet name | Count |
|---|
| FULLERS MILL RD | 4 | | GENERAL THOMAS HIGHWAY | 4 | | GREEN STREET CRES | 4 | | MEHERRIN ROAD | 4 | | PINECREST DR | 4 | | PITTMAN ROAD | 4 | | POWELLS HILL RD | 4 | | RAILROAD AVE | 4 | | RAILROAD ST | 4 | | SOUTH MAIN ST | 4 | | SPRING GARDEN ST | 4 | | 15504 BOONE DR | 2 | | 17344 WASHINGTON STRE | 2 | | 18061 BEATON AVE. | 2 | | 18075 PITTMAN ROAD | 2 | | 18275 DELOTCH AVE | 2 | | 19343 CROSSKEY ROAD RD | 2 | | 27437 CLARKSBURY ROAD | 2 | | 35 | 2 | | BARROW ROAD | 2 | | BEATON AV | 2 | | BEATON AVE ST | 2 | | BOONE DR | 2 | | BOONE DR | 2 | | |
|
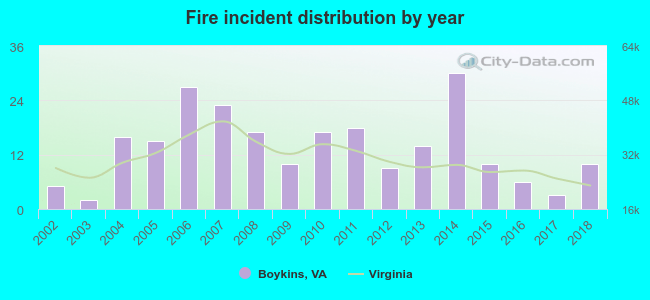 According to the data from the years 2002 - 2018 the average number of fires per year is 14. The highest number of fires - 30 took place in 2014, and the least - 2 in 2003. The data has an increasing trend.
 35.8% incidents where reported in the morning and 64.2% in the evening. The most fires (18.5%) took place on Friday, and the least (9.9%) on Tuesday.
 According to the 232 reports from years 2002 - 2018 most fires (15.5%) took place during April, and the least (3.0%) in October.
 Out of all 678 cases reported during the years 2002 - 2018, the most belonged to the categories: Rescue & EMS (35.0%), Fire (34.2%), and Hazardous Condition (10.5%).
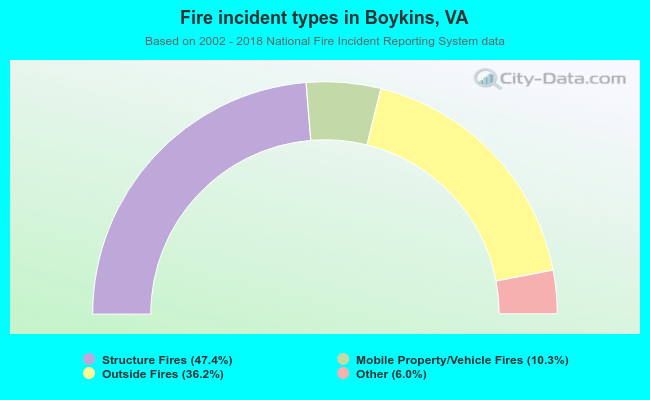 When looking into fire subcategories, the most incidents belonged to: Structure Fires (47.4%), and Outside Fires (36.2%).