| Fire incidents reported |
|---|
| Sreet name | Count |
|---|
| OLD STATE RD | 20 | | MAIN ST | 12 | | LAKE ST | 10 | | BOYNE CITY RD | 8 | | KORTHASE RD | 8 | | ADDIS RD | 6 | | MARSHALL RD | 6 | | WILSON RD | 6 | | ADVANCE RD | 4 | | BOYNE AVE | 4 | | CAMP DAGGET RD | 4 | | DIETZ RD | 4 | | DIVISION ST | 4 | | ETCHER RD | 4 | | FERRY RD | 4 | | HEMLOCK ST | 4 | | HORTON BAY RD | 4 | | JERSEY ST | 4 | | LEXAMAR DR | 4 | | OLD HORTON BAY RD | 4 | | PARK ST | 4 | | PLEASANT AVE | 4 | | SHADOW TRAILS RD | 4 | | SNYDER RD | 4 | | SUMNER RD | 4 |
| | | Fire incidents reported |
|---|
| Sreet name | Count |
|---|
| TIMBER RIDGE TRL | 4 | | WILDWOOD HARBOR RD | 4 | | 3409 CAMP SHERWOOD RD. RD | 2 | | AIR INDUSTRIAL DR | 2 | | BARBER RD | 2 | | BC EJ RD | 2 | | BC/EJ RD | 2 | | BEIHLING RD | 2 | | BONNER LN | 2 | | BONYE CITY EAST JORDAN RD | 2 | | BOYNE CITY EAST JORDAN RD | 2 | | BOYNE CITY ROAD | 2 | | BOYNE CITY/EAST JORDAN RD | 2 | | CALL ST | 2 | | CAMP DAGGETT RD. | 2 | | CAMP SHERWOOD RD | 2 | | CEDER ST | 2 | | CHARLEVOIX ST | 2 | | CHARLIVOIX ROAD | 2 | | CHULA VISTA DR | 2 | | CHURCH RD | 2 | | CLUTE RD | 2 | | CROZIER RD | 2 | | DAM RD | 2 | | DEER LAKE RD | 2 |
|
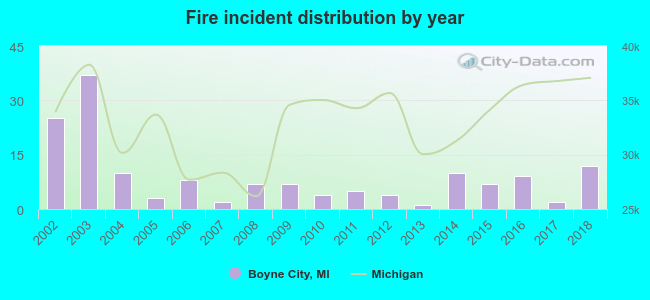 Based on the data from the years 2002 - 2018 the average number of fires per year is 9. The highest number of fires - 37 took place in 2003, and the least - 1 in 2013. The data has a decreasing trend.
 39.9% incidents where reported in the morning and 60.1% in the evening. The most fires (20.3%) took place on Friday, and the least (8.5%) on Tuesday.
 According to the 153 reports from years 2002 - 2018 most fires (13.1%) took place during April, and the least (2.6%) in June.
 Out of all 575 cases reported during the years 2002 - 2018, the most belonged to the categories: Fire (26.6%), Hazardous Condition (26.4%), and Good Intent Call (16.5%).
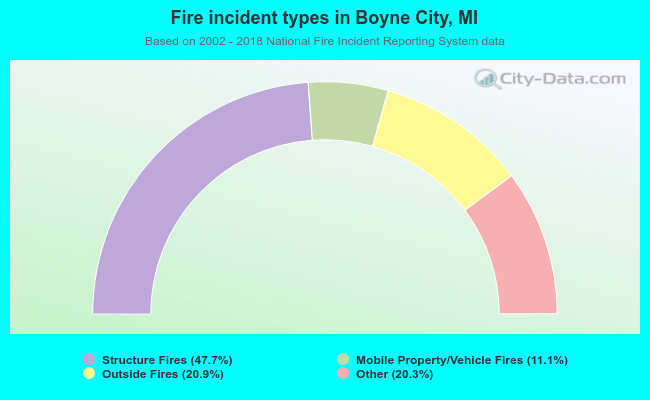 When looking into fire subcategories, the most reports belonged to: Structure Fires (47.7%), and Outside Fires (20.9%).